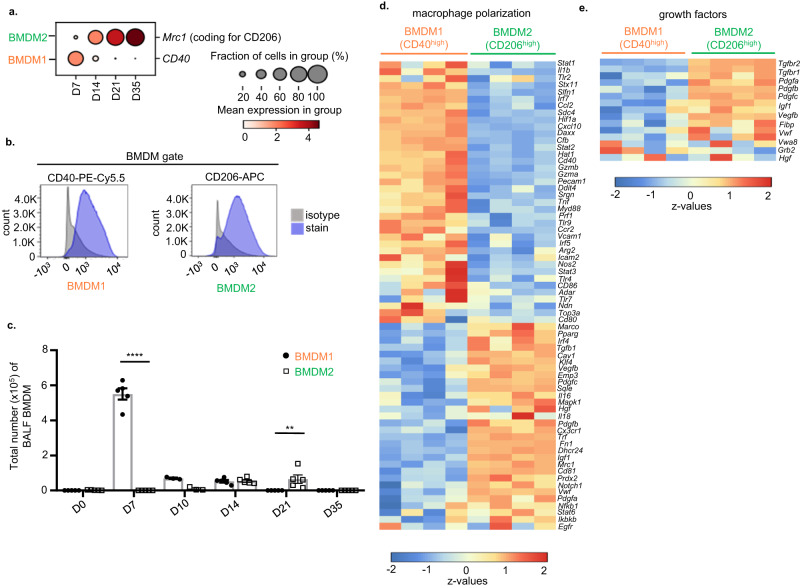
Fig. 2. CD40 and CD206 expression identify BMDM1 and BMDM2 clusters in the lungs of IAV-infected mice.
a Dot plot graph showing expression of CD40 and CD206 in BMDM1 and BMDM2, respectively. The size of the dots encodes the percentage of cells within a cluster expressing the particular marker. Color of the dots represents the average expression level throughout all cells within a cluster. Data refer to the scRNA-seq experiment in Fig. 1. b Representative FACS histograms displaying CD40 expression in BMDM1 and CD206 expression in BMDM2 collected from BALF of IAV-infected mice on days 7 and 21, respectively. c Bar graphs show total BMDM1 and BMDM2 cell counts in BALF samples of mice at the indicated time points. Values are representative of three independent experiments shown as mean ± SEM with individual data points for each group with n = 5, except for D10 samples where n = 3. Probability determined using two-way ANOVA (Holm–Sidak’s multiple comparisons test) ****p < 0,0001, **p = 0.0043; for comparison between BMDM1 and BMDM2. d Heatmap of DNA microarray profiling depicting genes associated with macrophage polarization phenotypes and e with genes associated to epithelial growth factor signaling in CD40high BMDM1 and CD206high BMDM2 flow-sorted from BALF of IAV-infected mice at D7 and D21 p.i., respectively; prior gating of BMDM was performed according to Supplementary Fig. 2a. Source data are provided as a Source Data file. BMDM bone marrow-derived macrophage, BALF bronchoalveolar lavage fluid, D day.

