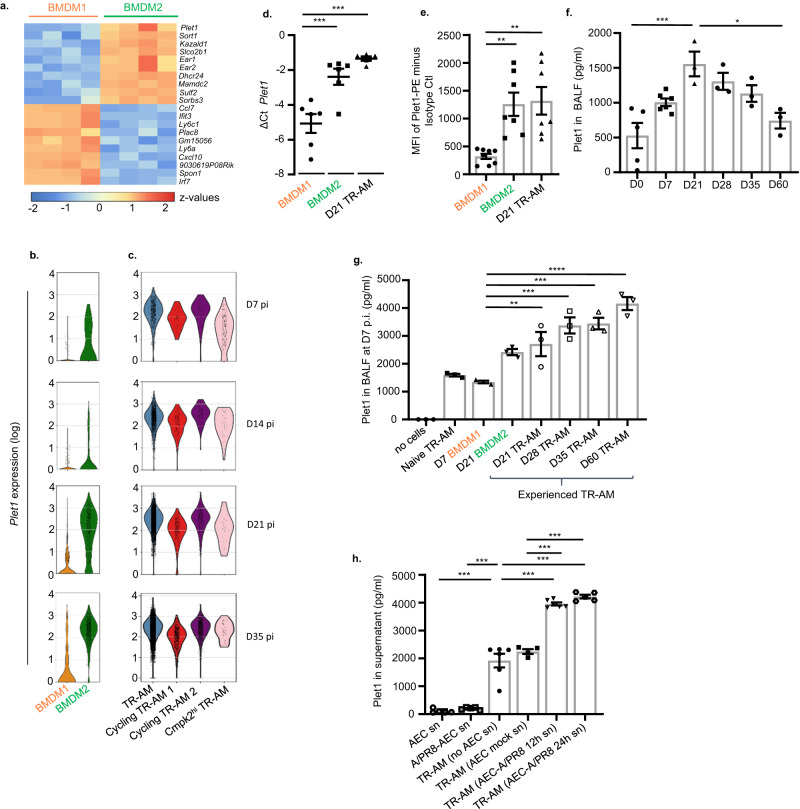
Fig. 4. BMDM2 and TR-AM are characterized by increased Plet1 expression and release compared to BMDM1.
a Heatmap of cDNA microarray analysis showing top 10 DEG in BMDM2 versus BMDM1 flow-sorted at D7/D21 p.i., respectively. Genes shown in the heatmap were selected according to p value (p < 0.05). b Violin plots showing expression level (log) of Plet1 in BMDM and c in TR-AM of IAV-infected mice at D7, D14, D21 and D35. Colored areas indicate density distribution in each cluster. Data refer to scRNA-seq experiments in Fig.1b. d Comparative Plet1 mRNA expression analysis by qPCR in BMDM1 of IAV-infected mice obtained at D7; in BMDM2 and TR-AM at D21 p.i. Results are expressed as ΔCt value (Ct reference−Ct target) (n = 6) (**p = 0.0016, ***p = 0.0001). e Mean fluorescence intensity (MFI) of Plet1 (PE) analyzed by FACS in BMDM1 (D7 p.i.) (n = 8), BMDM2 (D21 p.i.) (n = 7) and TR-AM (D21 p.i.) (n = 7) from BALF of IAV-infected mice (**p = 0.0042, ***p = 0.0025). f Quantification of soluble Plet1 in BALF of IAV-infected WT mice at D0/7/21/28/35/60 p.i. n = 3 except on D0 where n = 5 and D7 where n = 6 (*p = 0.0164, ***p = 0.0007). g Quantification of soluble Plet1 in BALF of D7 IAV-infected Ccr2-/- mice, adoptively transferred at D3 p.i. with BMDM or TR-AM subsets flow-sorted from BALF of IAV-infected WT mice at the indicated time points (n = 3) (**p = 0.0087, ***p = 0.0001, ****p < 0.0001). h Plet1 concentration in supernatant of non-infected or infected AEC (24 h) (n = 5); in supernatant of BALF-isolated TR-AM treated for 12 h with conditioned medium of non-infected (n = 4) or infected AEC (12 h, n = 6, and 24 h, n = 5) or of untreated TR-AM (n = 6) (***p < 0.0001). Data are representative of three independent experiments shown as mean ± SEM statistical differences were calculated using one-way ANOVA and Tukey’s post-hoc tests. BMDM bone marrow-derived macrophage, AEC alveolar epithelial cell, BALF bronchoalveolar lavage fluid, TR-AM tissue-resident alveolar macrophage, D day. Source data are provided as a Source Data file.

