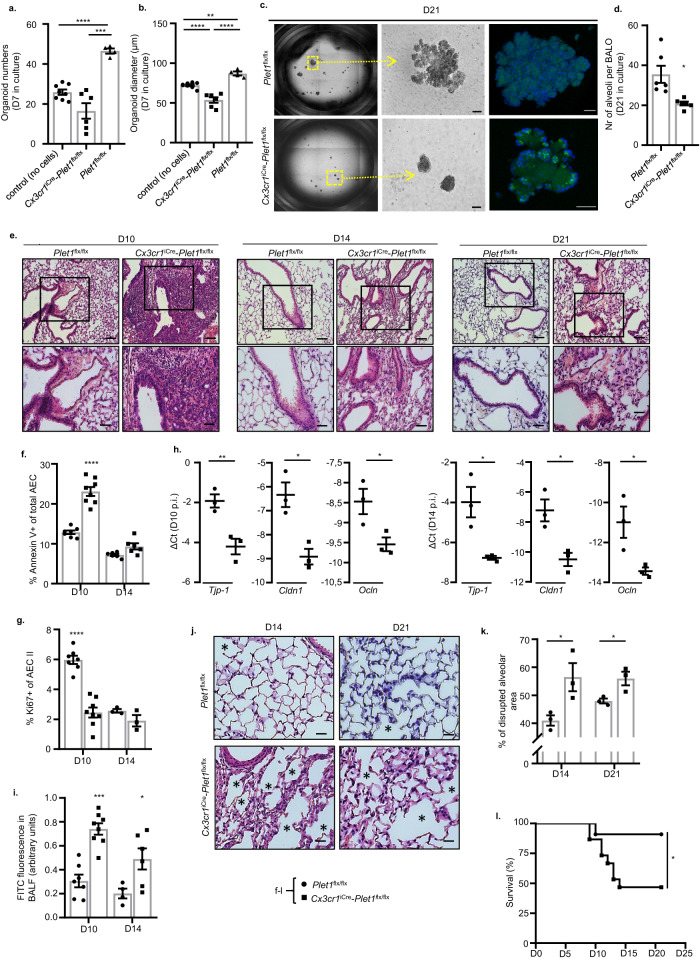
Fig. 6. BMDM2-expressed Plet1 drives epithelial progenitor (AEC II) cell expansion and improves lung barrier function in IAV-induced lung injury in vivo.
a Quantification of BALO numbers after 7D in culture (control) (n = 8) or co-culture with BMDM2 derived from Txf-treated control (Plet1flx/flx) (n = 4) or Cx3cr1iCre-Plet1flx/flx (n = 6) mice; single data points represent mean of organoid numbers per each well (***p = 0.0008, ****p < 0.0001). b BALO diameter (µm) from the same experiment; single data points represent mean diameter of organoids (n = 20–49) per each well. Groups: Control (no cells) (n = 8 well); Plet1flx/flx (n = 4 well) and Cx3cr1iCre-Plet1flx/flx (n = 6 well) (**p = 0.0026, ****p < 0.0001). c Representative image of BALO at 21D of culture, stained with LysoTracker® Green DND. The scale bar in the EVOS FL microscope images (middle) represents 50 µm while in confocal images 25 µm (top) and 50 µm (bottom). d Average numbers of alveoli per BALO from the experiment in (c); quantified from n = 6 BALO/group (*p = 0.0182). e Lung histological sections of IAV-infected, Txf-treated Cx3cr1iCre-Plet1flx/flx or Plet1flx/flx mice obtained after 10/14/21D p.i., stained with H&E. Images underneath are magnifications of the areas within squares. Scale bars represent 100 µm (top) and 50 µm (bottom). f Percentage of Annexin V+ AECs in Plet1flx/flx mice at day 10 (n = 7) and day 14 (n = 6) or Cx3cr1iCre-Plet1flx/flx mice at day 10 (n = 8) and day 14 (n = 6) (****p < 0.0001). g Percentage of Ki67+ AECs in Plet1flx/flx mice at day 10 (n = 7) and day 14 (n = 3) or Cx3cr1iCre-Plet1flx/flx mice at day 10 (n = 8) and day 14 (n = 3) (****p < 0.0001). h mRNA expression (qPCR) of tight junction component genes in the lung (n = 3) (Tjp-1 D10 **p = 0.01, D14 *p = 0.0224; Cldn1D10 *p = 0.013, D14 *p = 0.0185; Ocln D10*p = 0.0405, D14 *p = 0.0348). i Quantification of barrier dysfunction by FITC-Albumin fluorescence analysis in BALF of Plet1flx/flx mice at day 10 (n = 7) and day 14 (n = 4) or Cx3cr1iCre-Plet1flx/flx mice at day 10 (n = 8) (****p < 0.0001) and day 14 (n = 6) (*p = 0.0368). f–i refer to the experiment described in (e). j Lung sections of IAV-infected Plet1flx/flx or Cx3cr1iCre-Plet1flx/flx mice obtained at D14/21 p.i., stained with H&E. Scale bars represent 50 µm. Images provide a detailed visualization of specific regions from the corresponding images in 6e (bottom) while maintaining the same magnification as in 6e, bottom. * indicates areas of disrupted, non-repaired alveoli. k Quantification of disrupted alveolar area in lung slides of IAV-infected mice. Single data points represent the mean of three randomly chosen areas from each paraffin lung section (n = 3 biologically independent mouse lung sections for each group) (D14 *p = 0.0439, D21 *p = 0.0367). l Survival analysis of IAV-infected, Txf-treated Cx3cr1iCre-Plet1flx/flx (n = 15) or Plet1flx/flx mice (n = 11) (*p = 0.029). Data are representative of three independent experiments; bar graphs show means ± SEM and single data points. Significance was calculated using Brown Forsythe and Welch ANOVA followed by Games–Howell’s test on (a) and ANOVA followed by Tukey’s post-hoc tests in (b), two-sided Student’s t-test performed in (d), (Welch’s correction) (f) (Welch’s correction) (g, h, i, k) and Log-rank (Mantel–Cox) test in (l). AEC alveolar epithelial cell, BALO bronchoalveolar lung organoid, BALF bronchoalveolar lavage fluid, D day. Source data are provided as a Source Data file.

