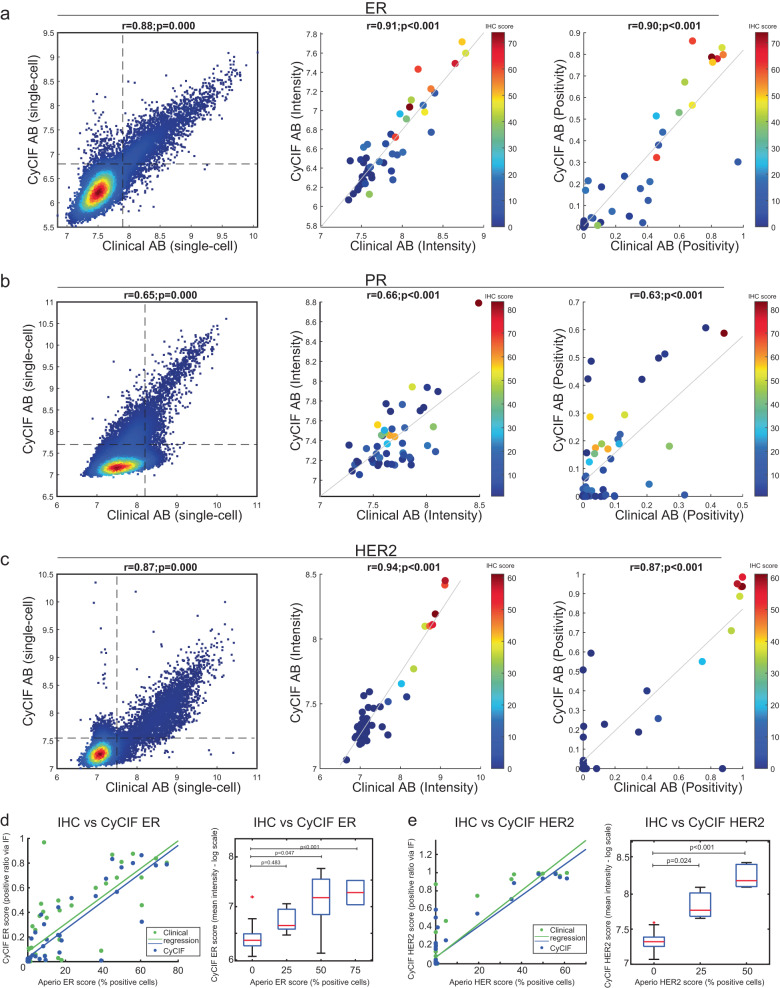
Fig. 2. Core-to-core comparison of clinical and CyCIF antibodies against ER, PR, and HER2.
To qualify breast cancer-related antibodies, the BC03 TMA, representing 16 breast tumors in duplicate was used. a–c CyCIF was performed using the qualified CyCIF antibody against a single antibody commonly used in clinical practice as a reference for ER (a), PR (b), and HER2 (c). The left graph depicts a single-cell dot-plot between the clinical clone on the x axis and the validated CyCIF antibody on the y axis. Each dot represents single-cell fluorescent intensity values from the two antibodies. Dashed lines indicate the gating cutoffs. The middle graph shows the corresponding mean log intensity of the core-to-core analysis of the clinical and CyCIF antibodies. The single-cell data were collected for individual TMA cores, with a binary gate applied to obtain the positive signal of each core (range from 0–1). The X- & Y axis represent the positive score calculated from either clinical or CyCIF antibodies, respectively. The right graph shows positivity scores (number of positive cells over total cells) for the clinical and CyCIF antibodies by TMA case. d, e Cross-assay comparison of the clinical and CyCIF antibodies analyzed by CyCIF compared to the clinical antibody analyzed by IHC using Aperio software for ER (d) and HER2 (e). Left, dot-plot representation of two different scores obtained from CyCIF and from IHC-Aperio. CyCIF of clinical (green dots) and CyCIF antibodies (blue dots) were used on the same section, while IHC was performed on a different section from the same TMA block. Each dot represents a single core from BC03 TMA. CyCIF scores are plotted on y axis as positive ratio of immunofluorescence, IHC scores on x axis are plotted as the percent of positive cells. Right graph, quantitative assessment of ER and HER2 IHC versus CyCIF staining. IHC scores by Aperio were used to stratify (0–24, 25–49, 50–74, 75–100) different TMA cores/cases, and the mean intensities of CyCIF antibody staining from each TMA core are shown using boxplot analysis. CyCIF antibodies: ER (CST 74244 S) and HER2 (ab225510).

