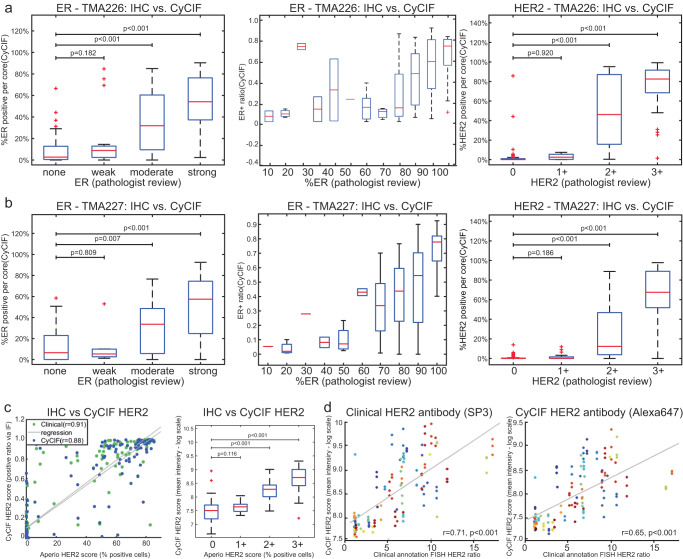
Fig. 3. Inter-assay analysis of HER2 enriched TMAs (TMAs 226 and 227).
Following the selection of qualified ER, PR, and HER2 antibodies, two HER2-enriched TMAs, which included 567 tissue cores (representing 189 patients in triplicate), were used to further qualify CyCIF antibodies. a, b Percent of ER+ and HER2+ cells assessed through CyCIF (y axis) is compared to the score assigned by a clinical pathologist (x-axis) for each TMA. c Cross-assay comparison of the HER2 clinical and CyCIF antibodies analyzed by CyCIF compared to the clinical antibody analyzed by IHC using Aperio software. Left, dot-plot represents two different scores obtained from CyCIF and one obtained from IHC-Aperio. CyCIF of clinical (green dots) and CyCIF (blue dots) antibodies were used on the same section, while IHC was done on a different section from the same TMA block. Each dot represents a single core from BC03 TMA. CyCIF scores are plotted on y axis as positive ratio of immunofluorescence, IHC scores on x axis plotted as percent of positive cells. Right, quantitative assessment HER2 IHC versus CyCIF staining. IHC scores by Aperio were used to stratify (0–24, 25–49, 50–74, 75–100) different TMA cores/cases, and the mean intensities of CyCIF antibody staining from each TMA core are shown using boxplot analysis. d Clinically annotated HER2 FISH scores against IF/CyCIF staining using the SP3 antibody (Pearson r = 0.71) and HER2 FISH scores against IF/CyCIF staining using the CyCIF antibody, ab225510 (Pearson r = 0.65). Individual patients are shown in different colors, in triplicate. The triplicate cores tend to cluster together, indicating minimal variation.

