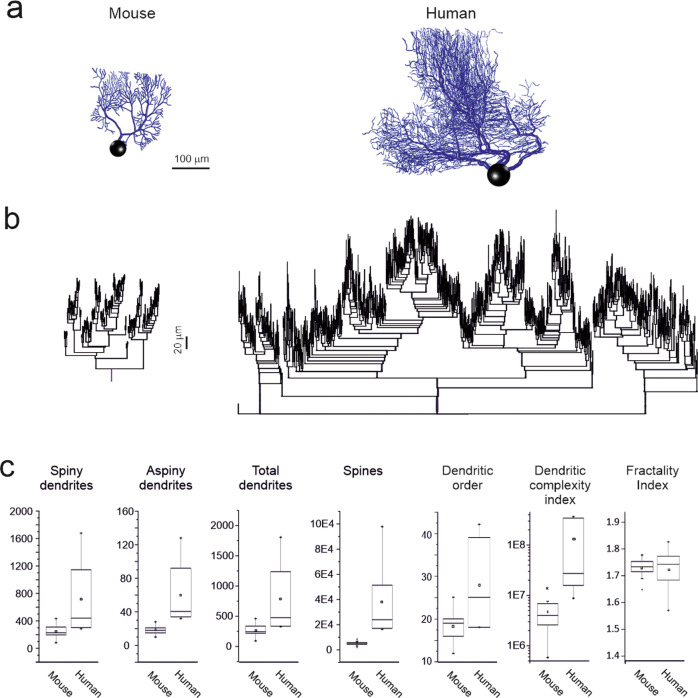
Fig. 2. Human and mouse PC morphological properties.
a Morphological reconstructions of a mouse and a human PC obtained from fluorescent confocal images of postmortem fixated brains (see Supplementary figure 3 for more reconstructions). Note the similar shape but greater size of the human PC compared to the mouse PC. b Dendrograms of the two PCs shown above. Note the similar architecture of dendritic ramification. c The boxplots show metrics measured from dendrograms of 19 mice and 6 human PCs. These include the number of spiny and aspiny dendrites, the total number of dendrites and spines, and the dendritic order. Note that all these parameters were larger in human than mouse PCs. The dendritic complexity index (DCI) was one order of magnitude higher in human than mouse PCs, while the fractality index was similar in human and mouse PCs. All the comparisons reported in the figure reveal a statistically difference at p < 0.01 (unpaired t-test) between human and mouse PC parameters, except for the fractality index. The square at the center of each box define the mean, the line in the box define the median and the x define the Outliers.

