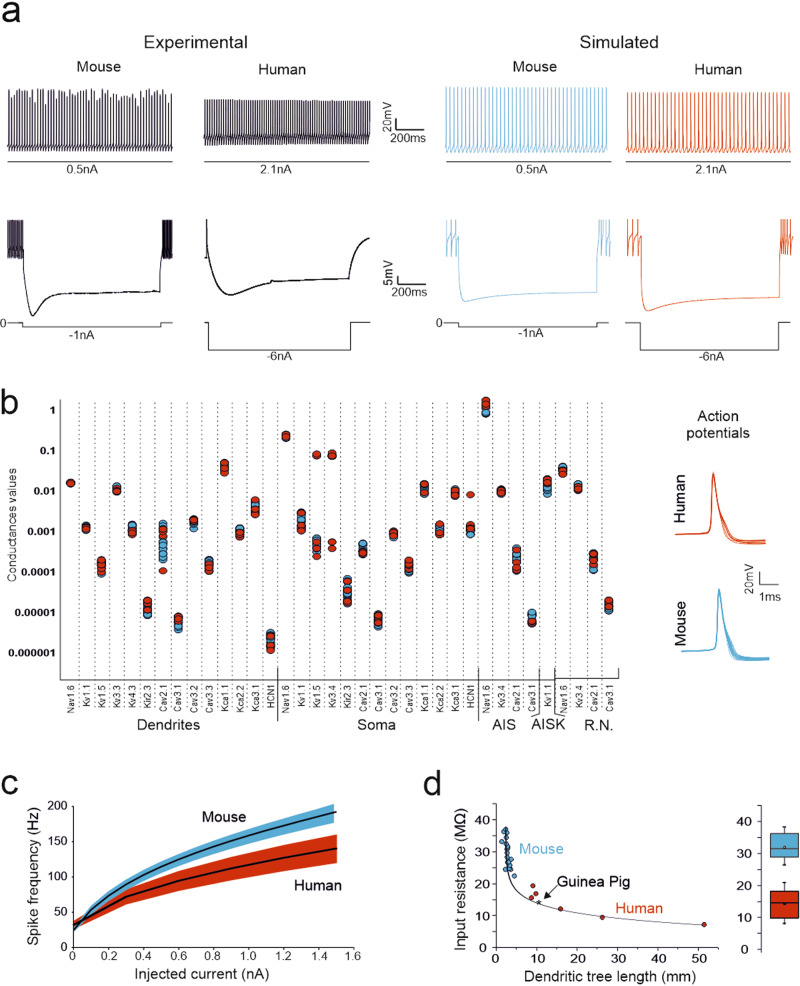
Fig. 3. Electrophysiological recordings and model simulations.
(a) experimental current-clamp recordings from a mouse and a human PC injected with positive (above) and negative (below) current steps. The two cells generated similar response patterns, but the human PC required higher current injection to attain the same responsiveness as that of the mouse PC.Simulations in a mouse and a human PC model injected with the same positive and negative current steps used in the experiments. Note that the mouse and human PC models generate similar responses, which closely correspond to those recorded experimentally. The higher current injection required by the human PC is due to the correspondingly lower Rin. (b) The plot shows the maximum ionic conductance in the 19 mouse and 6 human PC models covered in this paper (blue for mouse and red for human PCs). Note that, for each ionic channel, data values are similar and tend to cluster irrespective of animal species. The traces on the right show action potentials in the mouse and human PC models. Except for minor differences in the AHP trajectory, action potentials were almost identical in the two species. (c) I-F relationships (mean ± s.d. represented as a colored area) for mouse and human PC models. The I-F slope was 2.05 ± 0.14 times higher in mouse than human models reflecting higher Rin (see panel d). (d) Dependence of Rin on dendritic length in the mouse and human PC models (Rin was estimated using voltage-clamp step protocols). Rin is inversely correlated with the length of the dendritic tree along an exponential decaying function, i.e., PCs with longer dendrites have smaller Rin. Human PCs are in the right-hand branch of the curve, mouse PCs are in the left-hand branch, the guinea-pig PC35,36 is in the middle. The box plot shows statistics of Rin for all the mouse and human PC models.

