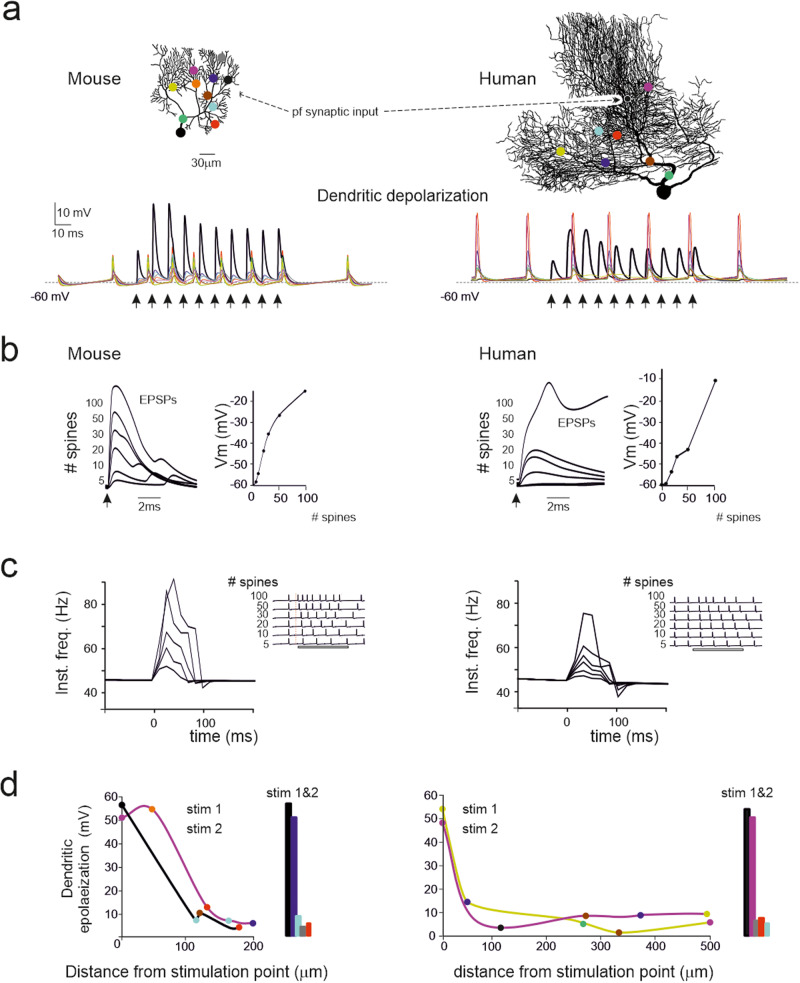
Fig. 8. Synaptic excitation in spiny dendrites.
a A mouse and a human PC model (the same as in Figs. 6–8) endowed with spines are activated by pf synapses (black dots) using bursts of 10 spikes at 100 Hz (arrows) on 50 and 89 spines, respectively. The traces show responses at the stimulation site (black) and at each other site (color coded). Note short-term facilitation in pf-PC EPSPs, a much larger response at the stimulated site than in any other sites, and synchronous back-propagated spikelets visible at all sites. (b) Dendritic EPSPs generated by activating an increasing number of pf synapses (second response in a train using the same impulse pattern used in A). The traces show EPSPs generated by an increasing number of spines and the plots on the right show the corresponding EPSP amplitude (the arrow indicates the stimulus). Note the sigmoidal shape of the activation curve (no response with 1 spine, rapid growth with an intermediate number of spines, tendency to plateau at more than 100 spines) both in mouse and human PC models. c Somatic spikes generated by activating an increasing number of pf synapses (same simulations as in b). The traces are spike trains (the arrows indicate the stimuli) elicited by an increasing number of activated spines. Note that the number of spikes elicited by the stimuli increases with the number of active synapses, as shown in the instantaneous frequency plots on the right. Note that in a–c the profile of EPSPs and spike responses is similar in mouse and human PC models, but the latter requires a larger number of active synapses. d PC model activation in the presence of synaptic noise. Synaptic stimuli were applied on two independent dendrites, either in isolation or combined, by activating 30% of the spines in each ROI with 5 spikes at 100 Hz on excitatory synapses and 3 spikes at 142 Hz on inhibitory synapses. The activity was recorded in the stimulated spines as well as in spines located elsewhere on the dendrites. The graphs show the net depolarization at a distance from the stimulation point. The histograms report the net depolarization with simultaneous stimulation in both sites (same color code as in panel a).

