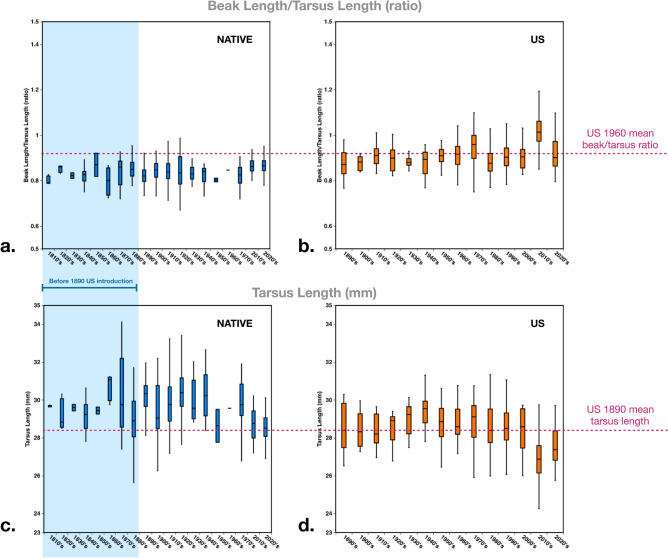
Figure 6.
(a) Ratio of whole beak length (mm) over tarsus length (mm), to correct for body size, plotted over each decade, native range 1816–2022 (blue), shaded blue area indicates time-period prior to 1890 introduction to the U.S. (b) Ratio of beak length/tarsus length in introduced U.S. range (orange) 1890–2020, pink dotted line across indicates mean for U.S. in 1960’s. (c) Tarsus length (mm) plotted over each decade, native range 1816–2022 (blue). (d) Tarsus length (mm) in introduced U.S. range (orange) 1890–2020, pink dotted line across indicates mean for U.S. in 1890’s.

