

Abstract
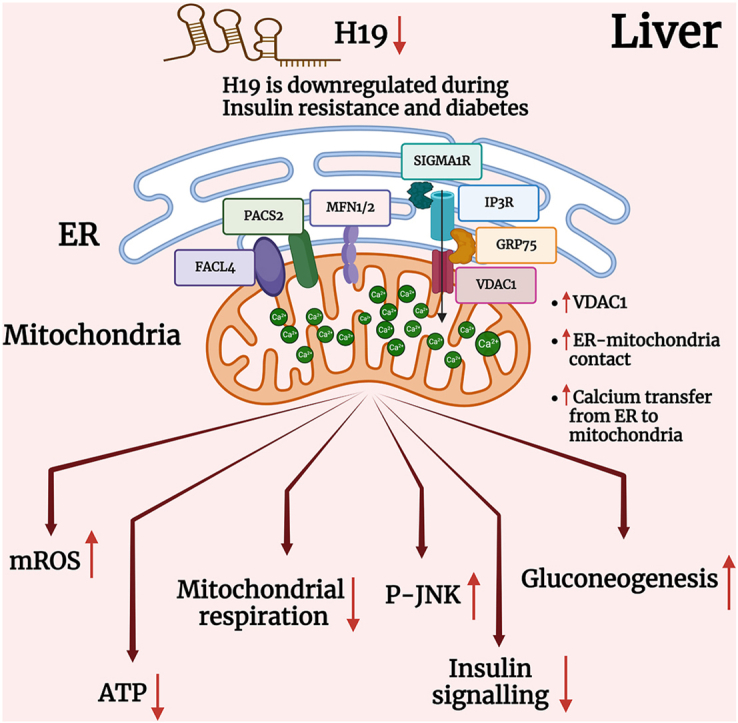
Inspite of exerting independent cellular functions, the endoplasmic-reticulum (ER) and the mitochondria also physically connect at specific sites termed mitochondria-associated ER membranes (MAMs) and these sites consist of several tethering proteins that play varied roles in diverse cellular processes. However, the regulation of these tethering proteins within the cell is relatively less studied. Here, we show that several MAM proteins are significantly altered in the liver during diabetes and among these, the lncRNA, H19 regulates the levels of VDAC1. Inhibition of H19 expression using H19 specific siRNA altered VDAC1, mitochondrial Ca2+ and oxygen consumption rate, ATP and ROS levels and enhanced ER and mitochondria coupling in Hepa 1–6 cells. While H19 inhibition did not impact lipid accumulation, levels of gluconeogenic genes were significantly increased. JNK-phosphorylation and IRS1-Ser307-phosphorylation were increased by H19 inhibition and this was associated with abrogation of insulin-stimulated AKT (Ser-473) phosphorylation and glucose uptake in Hepa 1–6 cells. While inhibition of VDAC1 expression using siRNAs and with metformin significantly rescued the effects of H19 inhibition, VDAC1 overexpression alone exerted effects similar to H19 inhibition, suggesting that VDAC1 increase mediates the adverse effects of H19. In-vivo H19 inhibition using specific siRNAs increased hepatic VDAC1, pJNK and pIRS1 (Ser307) levels and decreased AKT (Ser-473) phosphorylation in mice. These suggest an important role of the H19-VDAC1 axis in ER-mitochondria coupling and regulation of gluconeogenesis in the liver during diabetes.
Keywords: lncRNA, Diabetes, Liver, ROS, Gluconeogenesis, JNK, ER-Mitochondria communication, Ca2+
Graphical abstract
Highlights
-
•
LncRNA H19 and Mitochondria-associated ER membranes (MAM) proteins are altered in the liver during diabetes.
-
•
H19 inhibition in Hepa 1–6 cells increased VDAC1, mitochondrial Ca2+and ROS levels and enhanced ER-mitochondria coupling.
-
•
H19 inhibition increased pJNK, pIRS1(Ser307) and gluconeogenic genes' levels in hepatic cells.
-
•
In-vivo H19 inhibition increased hepatic VDAC1, pJNK and pIRS1(Ser307) levels and decreased pAKT levels in mice.
-
•
Hepatic H19-VDAC1 axis is critical in ER-mitochondria coupling and regulation of gluconeogenesis during diabetes.
1. Introduction
Cellular homeostasis depends on the appropriate functioning of the endoplasmic reticulum (ER) and mitochondria, and functional aberrancies at either location is frequently associated with various diseases [1,2]. Despite being independent organelles with discrete functions, they interact at specific sites where the membrane of ER and mitochondria are physically tethered to each other and are able to regulate mutual functions. These sites of communication termed as Mitochondria-associated ER membranes (MAMs) have been extensively studied for their roles in exchange of lipids, calcium and other cellular components, autophagy and cell death [3,4]. The distance between ER and mitochondria varies from 10 to 25 nm [4,5] although some studies report distances in the range of 10–80 nm [6], depending on whether the interaction is with the smooth ER or rough ER. Several proteins with varied roles constitute the MAM fraction that are conserved structures across eukaryotes. Prominent among these are the IP3R-GRP75-VDAC1 complex that form an oligomeric subunit involved in calcium transfer from ER to mitochondria, homo or heterodimeric tethers formed between MFN2 on the ER and either MFN1 or MFN2 on the mitochondria and important in cell signalling and MAM stability, FACL4 involved in the conversion of fatty acids to acyl CoA which is then transferred to mitochondria and other proteins like CyclophilinD (CYPD), Sigma-1 receptor (Sig-1R), PACS2, DJ1, etc that are involved in maintaining the structure and function of MAMs [4,[6], [7], [8], [9], [10]].
The relevance of MAMs in cellular pathways and function make them significant determinants of aberrations as seen in Alzheimer's disease, Parkinson's disease, Non-alcoholic fatty liver disease (NAFLD), diabetes and cancers [6,7]. However, there are conflicting reports on the roles of several MAM proteins and ER-mitochondria communication within the liver during obesity. Some reports demonstrate that increased MAM formation and augmented ER-mitochondrial interaction precede the development of hepatic insulin resistance [11] and PACS2, a MAM tethering protein-knockout mice on a HFD (high-fat diet) diet have reduced hepatic lipid deposition, triglycerides and cholesterol levels together with decreased blood glucose levels [12,13]. On the other hand, MAMs are disrupted in ob/ob mice and HFD and HFHSD (high-fat high-sucrose diet) -fed mice and decreased ER and mitochondria interaction leads to insulin resistance in the liver [14] and skeletal muscle [15]. Loss of CYPD decreases MAM integrity resulting in ER stress and impaired hepatic insulin signaling [16] and pharmacologically improving MAM integrity restores insulin sensitivity in these mice [14]. These inconsistencies might primarily be due to the dynamic and plastic nature of MAM formation and breakdown, that depends on age, metabolic status, diet, stress and several other genetic and environmental cues.
All these determining factors dictate regulatory elements that govern the status of MAMs within the cell. Specifically, non-coding RNAs like the lncRNA, Malat1 regulates MFN1 levels by sponging miR-26b-5p in endothelial cells and this decreases mitochondria dependent apoptosis and enhances resistance to hypoxia mediated injury and myocardial infarction in mice [17]. By regulating MFN2 levels, miR-761 affects mitochondrial function and cell proliferation in hepatocellular carcinoma tissues [18]. The lncRNA H19 is widely studied and has been shown to regulate MAM proteins like VDAC1 and MFN2 in muscles during diabetes [[19], [20], [21]]. H19 and MFN2 mRNA levels are altered in the kidneys during diabetes and dysregulation of the lncRNA H19/MFN2 axis might be crucial in the pathogenesis and/or the progression of renal complications during diabetes [19]. LncRNA H19 releases miR-675 and by targeting VDAC1, the H19/miR-675 axis is involved in the regulation of high glucose-induced apoptosis [21]. These studies account for the metabolic significance of deregulated levels of diverse non-coding RNAs including H19.
The gene encoding H19 is maternally expressed and encodes a 2.3 kb transcript [22]. It is associated with genomic imprinting and development [23] and implicated in various cellular processes, including cell proliferation and differentiation [24]. Dysregulation of H19 is linked to cancer and diabetes [25,26] and it functions as a molecular sponge for microRNAs, regulating their activity and influencing gene expression networks [27]. In the skeletal muscle of T2D patients, H19 interferes with glucose uptake by regulating the expression of vital target genes such the insulin receptor and lipoprotein lipase by sponging members of the let-7 family [28]. Previous studies from our laboratory have demonstrated decreased hepatic H19 levels during diabetes and its regulation of hepatic gluconeogenesis, insulin signaling and glucose output [29].
In this study, we explored the roles of H19 in determining the levels of MAM proteins within the liver and the consequences of this regulation on ER-mitochondria crosstalk, hepatic insulin signaling and gluconeogenesis.
2. Materials and Methods
2.1. Cell culture
Hepa1-6 cells were cultured in DMEM high glucose media supplemented with 10 % FBS, antibiotic and antimycotic, at 37 °C and 5 % CO2. At around 30–40 % confluence, they were transfected with either the scramble or H19 siRNA (0.1–20 nM, R-173849-00-0010, Dharmacon, USA) [29] using Lipofectamine RNAiMax for 48 h. In another set of experiment Hepa1-6 cells were transfected with either the scramble or H19 siRNA (5 nM) with or without VDAC1 SMARTpool siRNA (5 nM, sense: 5′GAGUAUGGGCUGACGUUUA3′, 5′CGGAAUAGCAG CCAAGUAU3′, 5′GCAGUUGGCUAUAAGACGG3′ and 5′GGACUGGAAUUUCAAGCAU3′, L-047345-00-0005, Dharmacon, USA) for 48h; on termination of incubation, cells were pelleted and lysed for western blotting as described below. For the overexpression experiments, Hepa1-6 cells were transfected with either the empty vector or the VDAC1 overexpression vector (0.5–1.0 μg); cells were lysed and lysates used for Western Blot. For evaluating the effects of H19 inhibition on insulin signaling, scramble and H19 siRNA (5 nM) transfected Hepa1-6 cells were serum starved for 6 h and incubated in absence or presence of insulin (10 nM, 30 min). On termination of incubation, cells were lysed and the status of insulin stimulated AKT phosphorylation was assessed by Western blotting as described below. For experiments with metformin, Hepa 1–6 cells were incubated with metformin alone or transfected with either scramble or H19siRNA (5 nM) in the presence or absence of metformin (1000 μM) (RM10257-5G, HIMEDIA, Maharashtra, India) for 42h [30]; after competition of incubation, total RNA was isolated and subjected to qRT-PCR as mentioned below.
2.2. Quantitative RT-PCR
Total RNA was isolated from mice liver tissues or from Hepa 1–6 cells transfected as above using TRIzol, quantified using TECAN Infinite M200 Pro (Maennedorf, Switzerland) and 1 μg RNA was reverse transcribed using random hexamers and the transcript levels of H19, MAM proteins (Grp75, Facl4, Mfn1, Mfn2, Vdac1, Pacs2, Sigma1R, Ip3r1), Mcu, a protein involved in Ca2+ passage to mitochondria, genes of fatty acid and cholesterol metabolism (Fasn, Dgat2, Hmgcr, Hmgcs, Hadha, Acadl), gluconeogenesis ((G6pase (Glucose-6-phosphatase), Fbp1 (Fructose 1–6, bisphosphatase), Pck1 (Phosphoenolpyruvate carboxykinase), Pcx (Pyruvate carboxylase)) and mitochondrial electron transport chain ((Nd 4 (NADH dehydrogenase 4), Nd 6 (NADH dehydrogenase 6), Cyt B (Cytochrome B), Qcr (ubiqunol cytochrome C reductase core protein1), Cox 1-5b (Cytochrome c Oxidase subunit 1-5b), Atpase 6 (ATP synthase subunit 6), Atp5a1 (ATP synthase F1 subunit alpha), Atp5b (ATP synthase F1 subunit beta), Atp5c1 (ATP synthase F1 subunit gamma)) were evaluated by Real-Time-PCR using specific primers (Table 1) and SYBR green master mix in a Step One Plus RT-PCR system (Applied Biosystems, Singapore). All experiments were done in triplicates and 18S rRNA was used as the normalizing control. Data was analyzed by the 2−ΔΔCt method and results are represented as fold change or relative gene expression.
Table 1.
Primer sequences used in qRT-PCR.
| Gene name | Primer sequence [5′–3′] |
|---|---|
| H19 | Forward: CCTCAAGATGAAAGAAATGGTGCTA |
| Reverse: TCAGAACGAGACGGACTTAAAGAA | |
| Grp75 | Forward: GCGTCTTATTGGACCACGAT |
| Reverse: TGGCCCAAGTAATTTTCTGC | |
| Mfn1 | Forward: GACAGACTGGCCTCGAATC |
| Reverse: TGCAGTGATGGCTTTCTTTG | |
| Mfn2 | Forward: GCCAGCTTCCTTGAAGACAC |
| Reverse: GCAGAACTTTGTCCCAGAGC | |
| Facl4 | Forward: CGCTGGTGGAATCCTACGTA |
| Reverse: ATCAGCAACAGCAAGCAGAC | |
| Pacs2 | Forward: GAACTCCTGTCCGTGGTGAT |
| Reverse: AGAAGGTCAGAGCCAGGTCA | |
| Vdac1 | Forward: TACAGCAGAAACCCCATTCC |
| Reverse: TGCTTCCGAGCAGATAGGAT | |
| Sigma1R | Forward: CATGGCCATTCGGGACGATA |
| Reverse: GTGCTGAAGAAAGTGTCGGC | |
| Ip3r1 | Forward: GTAGGAGCTGTCCCCTTAGGA |
| Reverse: AAGCGAGACCCAGGTACAAA | |
| Fasn | Forward: TGCACCTCACAGGCATCAAT |
| Reverse: GTCCCACTTGATGTGAGGGG | |
| Dgat2 | Forward: ACTGGAACACGCCCAAGAAA |
| Reverse: GTAGTCTCGGAAGTAGCGCC | |
| Hmgcr | Forward: TGCGTAAGCGCAGTTCCTT |
| Reverse: CACAGTCCTTGGATCCTCCG | |
| Hmgcs | Forward: GTCTGATCCCCTTTGGTGGCT |
| Reverse: TGAAAGAGCTGTGTGAAGGACAGA | |
| Hadha | Forward: CGGCTACGGAAGTACGAGT |
| Reverse: CTGCCAGGTCTGGGTTAGTG | |
| Mcu | Forward: CGCCGTTTCCAGTTGAGAGA |
| Reverse: GAAGCCGGCCTCTGGTG | |
| Acadl | Forward: TGCACACATACAGACGGTGC |
| Reverse: CATGGAAGCAGAACCGGAGT | |
| G6pase | Forward: GTCGTGGCTGGAGTCTTG |
| Reverse: CGGAGGCTGGCATTGTAG | |
| Fbp1 | Forward: CTGATATTCACCGCACTCTGG |
| Reverse: CGGCCTTCTCCATGACATAAG | |
| Pck1 | Forward: TGGGAACTCACTACTCGGGA |
| Reverse: AGTTATGCCCAGGATCAGCAT | |
| Pcx | Forward: GGACTCCTTTGGACACAGAG |
| Reverse: AATCTCATTCTCATACACGTCGG | |
| 18S rRNA | Forward: AGAAACGGCTACCACATCCA |
| Reverse: CCCTCCAATGGATCCTCGTT | |
| Vdac1 Cloning primers | Forward Xho1 site: CCGCTCGAGATGGCCGTGCCTCCCACATAC |
| Reverse Xba1 site: CTAGTCTAGATTATGCTTGAAATTCCAGTCCTAGGCC | |
| ND4 | Forward:CATCACTCCTATTCTGCCTAGCAA Reverse:CCTCGGGCCATGATTATAGTAC |
| ND6 | Forward:AGGTGAAGGCTTTAATGCTAACCC Reverse:GGTCGCAGTTGAATGCTGTGT |
| Cyt.b | Forward:GCCACCTTGACCCGATTCT Reverse:TTGCTAGGGCCGCGATAAT |
| QCR1 | Forward:GCTGGGCGCACACTTTGT Reverse:CACTGGCCTTGCAGGAAGAA |
| Cox 1 | Forward:TTTTCAGGCTTCACCCTAGATGA Reverse:GAAGAATGTTATGTTTACTCCTACGAATATG |
| Cox2 | Forward:CCATCCCAGGCCGACTAAA Reverse:TTTCAGAGCATTGGCCATAGAA |
| Cox3 | Forward:CGGAAGTATTTTTCTTTGCAGGAT Reverse:CAGCAGCCTCCTAGATCATGTG |
| Cox4 | Forward:TGCAGACCAAGCGAATGCT Reverse:TAGTCCCACTTGGCGGAGAA |
| Cox5b | Forward:CGTCCATCAGCAACAAGAGAATA |
| Reverse:GCAGCCAAAACCAGATGACA | |
| ATPase6 | Forward:GGCTCCCGACACAAACTAAAAAG Reverse:TGGAATTAGTGAAATTGGAGTTCCT |
| ATP5a1 | Forward:ATGTGTCCGCTTACATTCCAACAA Reverse:GATCCGACACGGGACACAGA |
| ATP5b | Forward:ACATGGGCACAATGCAGGAA Reverse:GTCAGGTCATCAGCAGGCACA |
| ATP5c1 | Forward:AAGTTCGAAACATGGCAACTCTGA Reverse:ACTTTGCAGCTGCCACCATC |
| Short arm mito D-loop | Forward: CCCAGCTACTACCATCATTCAAGT |
| Reverse: RP- GATGGTTTGGGAGATTGGTTGATG | |
| Nuclear β2M | Forward: GTGACCAAGACTCGTGAGGA |
| Reverse: ATGCCACAGGTTCATCATGC |
2.3. Western blotting
Transfected Hepa 1–6 cells were lysed or mice liver tissues were homogenised in RIPA lysis buffer containing protease and phosphatase inhibitors. Lysates (20–40 μg) were separated using SDS-PAGE (6 %–12 %), transferred on nitrocellulose or PVDF membranes and blocked with 5 % BSA followed by incubation overnight at 4 °C with primary antibodies against GRP75 (Cat no. 2799), FACL4 (Cat no. 155282), MFN1 (Cat no. 57602), MFN2 (Cat no. 56889), SIGMA1R (Cat no. 53852), VDAC1 (Cat no. 14734), G6Pase (Cat no. 83690), p-IRS1(S307) (Cat no. 5599), MCU (Cat no. 121499): Abcam, Cambridge, UK; IP3R1/2/3 (Cat no. 85685), PCK1 (Cat no. 12740), FBP1 (Cat no. 59172), p-JNK1/2 (Cat no. 9255), ERK1/2 (Cat no. 4695), p-ERK1/2 (Cat no. 4377), p38 (Cat no. 9228), p-P38 (Cat no. 9216), IRS1 (Cat no. 2390), p-AKT (Ser473, Cat no. 4060) and AKT (Cat no. 4685): Cell Signaling Technology, MA, USA; JNK (Cat no. sc7435), HSC 70 (Cat no. sc7298), β-actin (Cat No. sc81178), vinculin (Cat no. sc73614): SantaCruz Biotechnology, Texas, USA); Pcx (SAB2500845, Sigma, St. Louis, USA) and PACS2 (PA5-72866, Thermo, MA, USA) using specific antibodies. Immunoreactive bands were detected using ECL Chemiluminescence kit (Gbiosciences, USA) Vinculin, β-actin or HSC70 were used as loading controls.
2.4. Mitochondrial DNA
Total DNA was isolated from Hepa 1–6 cells transfected with either the scramble or H19 siRNA (5 nM, for 48h) and mitochondrial DNA content was quantified using mitochondrial short D-loop primers (Table 1) by RT-PCR as described above. β 2 microglobulin (β2M) was used as a normalization control.
2.5. VDAC1 cloning
The full length mouse VDAC1 gene was cloned in an inducible pcDNA4/TO/HisA vector (Invitrogen, USA) using specific primers (Table 1). Hepa 1–6 cells were co-transfected with either the empty vector (pcDNA4-TR4) or the VDAC1 Clone (0.5 or 1 μg) and TR6 inducible plasmid (3 or 6 μg) using Lipofectamine 2000. After 24h, cells were induced with tetracyclin (1 μg/ml) for 48h and on termination of incubation, cells were lysed and subjected to Western blotting, apoptosis assays, intracellular Ca2+ and mitochondrial oxygen consumption measurements.
2.6. Intracellular Ca2+ measurement
Fluo-3AM and Rhod-2AM (Invitrogen, Oregon, USA) were used to determine calcium concentrations within the cytoplasm and mitochondria, respectively. Hepa 1–6 cells were grown in twelve well plates and transfected with either the scramble or H19 siRNA (5 nM). After 48h, cells were trypsinized, washed with 1X PBS and loaded with either Flou-3AM (1 μM) or Rhod-2 AM (1 μM) and incubated for 15 min at 37 °C. Cells were washed and fluorescence was measured in a flow cytometer (BD FACS Accuri C6 Plus, NJ, USA). Hepa 1–6 cells transfected with either empty vector or the VDAC1 clone (0.5 μg or 1 μg) were similarly analyzed for cytosolic and mitochondrial Ca2+ levels after 48h. Data are expressed as mean fluorescence per 10,000 cells.
2.7. Mitochondrial ROS measurement
The Mitosox fluorescent reagent (Invitrogen, Oregon, USA) was used to measure mitochondrial ROS production in Hepa1-6 cells transfected with either the scramble or H19 siRNA (5 nM, 48h) or with the either empty vector or VDAC1 clone (0.5 μg or 1 μg, 48h). On termination of incubation, cells were trypsinized, washed with 1X PBS and incubated for 15 min at 37 °C with 5 μM mitosox dye and the fluorescence was measured by flow cytometry (BD FACS Accuri C6 Plus, NJ, USA). Data are expressed as mean fluorescence per 10,000 cells.
2.8. Mitochondrial membrane potential
Mitochondrial membrane potential was determined according to manufacturer's protocol (Invitrogen, Oregon, USA). Briefly, Hepa 1–6 cells were grown in twelve well plates and transfected with either the scramble or H19 siRNA (5 nM). After 48h, cells were trypsinized, washed with 1X PBS and loaded with JC-1 dye (5 nM) (Invitrogen, Oregon, USA) and incubated for 15 min at 37 °C. Cells were washed and fluorescence was measured in a flow cytometer (BD FACS Accuri C6 Plus, NJ, USA). Results are expressed as the ratio of red and green fluorescence per 10,000 cells.
2.9. Bodipy staining
Hepa 1–6 cells were grown in twelve well plates and transfected with either the scramble or H19 siRNA (5 nM). After 48h, cells were trypsinized, washed with 1X PBS and loaded with Bodipy dye 493/503 (Invitrogen, Oregon, USA) at a concentration of 2.5 μM and incubated for 15 min at 37 °C. Cells were washed with 1X PBS and fluorescence was measured in a flow cytometer (BD FACS Accuri C6 Plus, NJ, USA). Data are expressed as mean fluorescence per 10,000 cells.
2.10. Mitochondrial oxygen consumption
The Seahorse Bioscience XFe24 extracellular flux analyzer (Agilent, CA, USA) was used to quantify the real-time mitochondrial oxygen consumption rate (OCR) according to manufacturer's protocol. Hepa1-6 cells were seeded in Poly-d-lysine coated XFe24 plates (Gibco, Montana, USA) at 2500 cells/well and kept at 37 °C and 5 % CO2 overnight. Cells were transfected with either scramble or H19 siRNA (5 nM, 48h) alone or with VDAC siRNA (5 nM) or with the empty vector or VDAC1 clone (1 μg). On termination of incubation, cells were washed three times with XF base medium DMEM without phenol red containing 2 mM glutamine, 1 mM sodium pyruvate and 10 mM of glucose and pH was set to 7.4 ± 0.2. Concentration of inhibitors used were 2 μM oligomycin, 1.25 μM FCCP, 2 μM of rotenone and antimycinA. All experiments were performed in triplicate and normalized to the total protein.
2.11. Mitochondria isolation and OCR determination
Mitochondria were isolated from scramble or H19 siRNA (5 nM, 48h) transfected cells using the mitochondria isolation kit (Sigma, St Louis, USA) according to manufacturer's protocol. On termination of incubation, cells were trypsinized, subjected to detergent lysis for 5 min on ice, centrifuged at 1000g for 10 min at 4 °C and the supernatant was further centrifuged at 3500g for 10 min at 4 °C. The pellet containing mitochondria was taken for OCR determination as described by Rogers et al. [31] using Seahorse Bioscience XFe24 extracellular flux analyzer (Agilent, CA, USA). For analysing mitochondrial respiratory coupling, isolated mitochondria (5 μg) was diluted in mitochondria assay solution (MAS, pH 7.2) and 50 μl of mitochondrial suspension was added to each well of the XFe24 plate containing 450 μl of pre-warmed (37 °C) MAS, succinate (10 mM) and rotenone (2 μM) as substrates. OCR was performed by sequentially measuring STATE2 (basal respiration in the presence of substrate but no ADP), STATE3 (in the presence of ADP (4 mM)), STATE4o (in the presence of oligomycin (2.5 μg/ml)) and STATE3u (in the presence of FCCP (4 μM)) respiration and finally suspended with addition of antimycin A (4 μM). All experiments were performed in triplicate.
2.12. Glucose output assay
Hepa 1–6 cells were grown in six well plates and transfected with either the vector or VDAC1 clone (1 μg). After 42h, the cells were washed with 1X PBS and incubated in no-glucose media containing sodium lactate (20 mM), sodium pyruvate (2 mM) and 0.5 % BSA for 6h, after completion of incubation the media was collected and glucose concentration was measured using glucose colorimetric/flourometric kit (Sigma, St. Louis, USA). Data was normalized to the total protein content.
2.13. Glucose uptake assay
Hepa 1–6 cells were grown in six-well plates and transfected with either the vector or VDAC1 clone (1 μg). After 42h, cells were washed with 1X PBS and incubated in glucose-free media for 6h and then incubated in absence or presence of insulin (10 nM, 30 min). On completion of incubation, cells were treated with 100 μM 2-NBDG (Invitrogen, Oregon, USA) for 1h. Uptake of 2-NBDG was stopped by washing twice with 1X PBS. Cells were then trypsinized, washed with 1X PBS and fluorescence was measured in a flow cytometer (BD FACS Accuri C6 Plus, NJ, USA). Data is presented as fluorescence intensity per 10,000 cells.
2.14. Glycolysis measurement
For real-time measurement of glycolytic rates, the Seahorse Bioscience XFe24 extracellular flux analyzer (CA, USA) was used according to manufacturer's protocol. Hepa1-6 cells were seeded in Poly-d-lysine coated XFe24 plates (Gibco, Montana, USA) at 2500 cells/well and kept at 37 °C and 5 % CO2 overnight. Cells were transfected with either scramble or H19 siRNA (5 nM, 48h). On termination of incubation, cells were washed with XF base medium DMEM without phenol red containing 2 mM glutamine, and pH was set to 7.4 ± 0.2. Concentration of inhibitors used were 10 mM glucose, 2 μM oligomycin, 100 mM 2-Deoxy-d-glucose. All experiments were performed in triplicate and normalized by total protein.
2.15. Total ATP measurement
ATP concentration was determined using the ATP determination kit (Invitrogen, Oregon, USA). Scramble or H19 siRNA transfected cells were lysed in 0.1 % Triton X-100 and ATP concentration was determined according to the manufacturer's protocol. Luminescence was measured in a TECAN Infinite M200 Pro plate reader and normalized to the total protein content.
2.16. Proximity ligation assay
In-situ proximity ligation assay using the Duolink kit (Sigma, St. Louis, USA) was used to assess the proximity between the mitochondria and ER. Specific probes against the mitochondrial protein, VDAC1 and the ER protein, IP3R were used. PLA was performed using by following the manufacturer's protocol. Hepa1-6 cells were cultured on chambered glass slides (Merck, Darmstadt, Germany) and transfected with either the scramble or H19 siRNA (5 nM) alone or together with VDAC1 siRNA (5 nM) or metformin (1000 μM) for 48h. On termination of incubation, cells were fixed, permeablized, blocked and incubated overnight with primary antibodies against VDAC1 (1:200, Cat no. 14734, Abcam, Cambridge, UK) and IP3R (1:200, Cat no. 05–1210, Sigma, St. Louis, USA) at 4 °C followed by incubation with secondary antibodies linked to complementary oligonucleotides (anti-rabbit PLUS and anti-mouse MINUS), ligation and amplification. Samples were mounted in Duolink mounting media containing DAPI and imaged in a confocal microscope (Nikon eclipse Ti 2, NY, USA) at a magnification of 60×. Experiments were performed at least three times and five fields were taken per condition. Quantification of PLA signals was done using the Image J software (https://imagej.nih.gov/ij/).
2.17. Apoptosis
Hepa 1–6 cells transfected with either empty vector or VDAC1 inducible vector (500 ng or 1 μg) and pcDNA6/TR6 (3 μg or 6 μg) were cultured in six-well plates. After completion of incubation, cells were trypsinized, washed with 1X PBS and apoptosis assay was performed according to manufacturer's protocol (Sigma, St. Louis, USA). Briefly, cells were incubated for 10 min at room temperature with 5 μL of Annexin V-FITC Conjugate and 10 μL of Propidium Iodide. Fluorescence was determined using flow cytometer (BD FACS Accuri C6 Plus, NJ, USA). Data are expressed as mean fluorescence per 10,000 cells.
2.18. Animal experiments
Male C57BLKs-db/+ normal mice (weighing 20.16 ± 2.8 g with blood glucose levels: 96.5 ± 5.40 mg/dl) and C57BLKs-db/db diabetic mice (weighing 36.07 ± 2.69g and blood glucose: 288.57 ± 73.5 mg/dl) aged 10–12 weeks (n = 7) were obtained from the CSIR-CDRI, Lucknow, India. Mice were kept under a 12:12 h light-dark cycle and had unrestricted access to food and water. After acclimatization for a week, mice were euthanized and liver tissues were collected for RNA and protein isolation to detect the levels of H19 and MAM proteins as described above. To study the effect of H19 downregulation in-vivo, C57BL/6J male mice were injected with either scramble or H19 siRNA as described by Goyal et al. [32]. Total RNA and protein were isolated from the liver tissues and used to assess the levels of H19, VDAC1 and gluconeogenic genes. All experiments were carried out in accordance with the guidelines of the Committee for the Purpose of Control and Supervision of Experiments on Animals (CPCSEA), New Delhi, India and were approved by Institutional Animal Ethics Committee (IAEC) of CSIR-IGIB, New Delhi, India.
2.19. Statistical analysis
Data are represented as means ± SEM, statistical analysis was done using the Graphpad PRISM tool. For analysis of two groups, student's t-test and for more than two groups, one way ANNOVA was used. p-value <0.05 was considered as statistically significant.
3. Results
3.1. MAM proteins are altered in the livers of diabetic db/db mice
We began the study by evaluating the levels of MAM proteins in the livers of diabetic db/db mice. As compared to normal db/+ mice, while there was a significant increase in the transcript and protein levels of MAM proteins namely MFN2, PACS2, SIGMA1R and VDAC1. Also, levels of MCU that is primarily involved in the passage of Ca2+ into mitochondria, was also significantly increased (Fig. 1A–F), FACL4 levels were significantly decreased (Fig. 1 A, G). There were no notable changes in the levels of GRP75, MFN1 and IP3R, either at the transcript or protein level (Fig. 1 A, H-J).
Fig. 1.

Expression levels of MAM proteins in livers of db/ + and db/db mice. (A) Total RNA was isolated from the livers of normal (db/+) and diabetic (db/db) mice and 1 μg RNA was reverse transcribed and subjected to qRT-PCR to assess the transcript levels of MAM proteins. 18S rRNA was used as the normalization control. Hepatic tissues of normal (db/+) and diabetic (db/db) mice were lysed and 20–40 μg lysates were run on SDS-PAGE and the levels of MFN2 (B), PACS2 (C), SIGMA1R (D), VDAC1 (E), MCU (F), FACL4 (G), GRP75 (H), MFN1 (I) and IP3R1/2/3 (J) were evaluated by Western Blot analysis. β-actin or Vinculin were used as the loading controls. Densitometric analyses of the blots are shown in the panels below. Data are means of at least four animals in each group and are presented as mean ± SEM. **p < 0.01, *p < 0.05, ns: non-significant.
3.2. LncRNA H19 inhibition increases VDAC1 levels in hepatic Hepa 1–6 cells
Since we observed changes in the hepatic levels of MAM proteins during diabetes, we explored the mediation of such changes by lncRNAs, if any. In a previous study from our laboratory, it was reported that the lncRNA, H19 is significantly downregulated in db/db mice liver [29] and we observed similar patterns of expression in the current experimental set of animals (Fig. 2A). To explore if such reduced levels of H19 can determine the differential status of MAM proteins, we down-regulated the levels of H19 in Hepa 1–6 cells using H19 siRNA (0.1–20 nM) and as compared to scramble, H19 siRNA caused a significant reduction of expression in endogenous H19 levels at 5 and 20 nM (Fig. 2B). Further, as compared to scramble, inhibition of H19 expression in Hepa 1–6 cells showed significant increase in the expression of transcript levels of only Vdac1 and Sigma1R (Fig. 2C); however, at the protein level, only VDAC1 expression was significantly increased in the presence of H19 siRNA (Fig. 2D). MCU and MAM proteins, namely MFN2, FACL4, PACS2 and SIGMA1R that are deregulated in the liver during diabetes (Fig. 1) did not show any change in expression by H19 inhibition (Fig. 2C, E-I).
Fig. 2.

H19 inhibition this alters levels of MAM proteins in Hepa 1–6 cells. (A) Total RNA was isolated from normal (db/+) and diabetic (db/db) mice (n = 5) livers and 1 μg RNA was reverse transcribed and subjected to qRT-PCR to assess the transcript levels of the lncRNA H19. 18S rRNA was used as the normalization control. (B) Hepa 1–6 cells were transfected with either the scramble or H19 siRNA (0.1–20 nM) and at 48h, the relative expression level of H19 was measured by Real time PCR as in “A”. (C) Total RNA was isolated from Hepa 1–6 cells transfected with either the scramble or H19 siRNA (5 nM) and the transcript levels of Facl4, Mfn2, Pacs2, Vdac1, Sigma1R and Mcu were evaluated by qRT-PCR. Hepa 1–6 cells transfected as in “C” were lysed and lysates (20–40 μg) were assessed for the protein levels of VDAC1 (D), MFN2 (E), FACL4 (F), PACS2 (G) SIGMA1R (H) and MCU (I) by Western Blot analysis. β-actin or Vinculin were used as the loading controls and densitometric analyses are given in the panels below. Data are presented as mean ± SEM of at least three independent replicates. ***p < 0.0001, **p < 0.01, *p < 0.05, ns: non-significant.
3.3. H19 inhibition leads to mitochondrial dysfunction in Hepa 1–6 cells
The above results suggest that decreased H19 levels, as seen in the liver during diabetes, results in increased VDAC1 levels, that possibly might mediate ER-mitochondria miscommunication and bring about cellular anomalies within the liver. VDAC1 is an approximately 32 kDa mitochondria-resident protein that interacts with IP3R on the ER through GRP75 at the MAM interface. It is involved in coupling energy demands to ATP generation and interacts with anti-apoptotic and apoptotic proteins and therefore plays a significant role in mitochondrial function and health and cell survival [[33], [34], [35]]. Since VDAC1 expression levels are increased by H19 inhibition, we sought to evaluate the effects of H19 inhibition on mitochondrial function and its interaction with the ER. H19 siRNA induced a significant increase in the interaction between the ER and mitochondria as assessed by increased IP3R-VDAC1 contacts represented by increased red blobs per nucleus in a proximity ligation assay (PLA) (Fig. 3A). As MAMs are involved in direct transfer of calcium from ER to mitochondria we probed mitochondrial calcium levels and as shown in Fig. 3B, there was significant increase in mitochondrial calcium levels in the presence of H19 siRNA; however cytosolic calcium levels remained unchanged (Fig. 3C). All these were accompanied by increased mitochondrial ROS (Fig. 3D) and decreased total ATP levels (Fig. 3E), all indicating potentially impaired mitochondrial function. Mitochondrial electron transport chain is essential for energy production in cells and sustained calcium exposure alters oxidative phosphorylation. Evaluation of oxygen consumption Rate (OCR) demonstrated a prominent reduction in basal and maximal respiration, proton leak, spare respiratory capacity and ATP production during H19 inhibition (Fig. 3F). This was additionally validated by assessing respiratory coupling of isolated mitochondria where as compared to scramble transfected cells, mitochondria isolated from H19 siRNA transfected cells demonstrated significant decrease in state 2 (basal respiration), state 3 (phosphorylating respiration in the presence of ADP) and state 4o (resting respiration with oligomycin) mitochondrial respiration. As compared to scramble, State 3u (maximal uncoupling respiration in the presence of FCCP) and response to antimycin A depicted minor non-significant decrease in the presence of H19 siRNA (Fig. 3 G). Further, evaluation of the transcript levels of proteins that are specific to the mitochondrial electron chain complexes suggested that Nd4 and Nd6 (complex I), Cox 1–3 (Complex IV) and Atpase 6, ATP5b and ATP5c1 (Complex V) were significantly downregulated in the presence of H19 siRNA (Fig. 3H), indicating that decreased levels of components of the mitochondrial electron transport chain possibly contribute to the observed decreased OCR. However, neither mitochondrial morphology and membrane integrity as evaluated by experiments with JC1 (Fig. 3I) nor mitochondrial number as evaluated by mitochondrial DNA content (Fig. 3J) was affected by H19 siRNA. Inspite of exerting significant changes in the mitochondrial electron transport chain, the glycolytic function was modestly (but not significant) impaired by H19 siRNA (Fig. 3K). All these suggest that decreased H19 levels promote increased contact between the ER and the mitochondria and this is associated with impaired mitochondrial function.
Fig. 3.

Inhibition of H19 induces mitochondrial dysfunction in Hepa 1–6 cells. (A) Hepa 1–6 cells transfected with either the scramble or H19 siRNA (5 nM, 48h) were subjected to in-situ proximity ligation assay using anti-VDAC1 and anti-IP3R antibodies. Representative confocal images of the cells are shown and the interaction between IP3R and VDAC1 is indicated by red dots. Nuclei are indicated by blue staining using DAPI. Quantification of IP3R-VDAC1 interactions is represented by red blobs per nucleus. Scale: 20 μm; Magnification: 60X. At least five images were captured per incubation. (B) Hepa 1–6 cells transfected with either the scramble or H19 siRNA (5 nM, 48h) were evaluated for total mitochondrial (B) and cytosolic (C) Ca2+ levels using Rhod-2 AM (1 μM) and Fluo-3 AM (1 μM), respectively, by FACS analysis. Mitochondrial ROS levels as detected by Mitosox (5 μM) (D) and total ATP (normalized to total protein) content (E) in Hepa 1–6 cells transfected with either the scramble or H19 siRNA (5 nM, 48h) are presented. (F) OCR of Hepa 1–6 cells transfected with either the scramble or H19 siRNA (5 nM) for 48 h in the presence of 2 μM oligomycin (ATP synthase inhibitor), 1.25 μM FCCP (uncoupling agent) and 2 μM rotenone and 2 μM antimycin (complex I and III inhibitors, respectively). Basal respiration, maximal respiration, proton leak, spare respiratory capacity and ATP production were determined as described in the “Methods” section. (G) Mitochondria was isolated from scramble and H19 siRNA transfected cells as described in the “Methods” section. OCR in isolated mitochondria (5 μg) from scramble and H19 siRNA transfected cells was performed in the presence of ADP (4 mM), oligomycin (2.5 μg/ml), FCCP (4 μM) and antimycin A (4 μM). (H) Total RNA was isolated from Hepa 1–6 cells transfected with either the scramble or H19 siRNA as in “A”, reverse transcribed and the transcript levels of genes specific to Complexes I, III, IV and V of the mitochondrial electron transport chain were evaluated by RT-PCR. 18S rRNA was taken as the normalization control. Scramble and H19 siRNA (5 nM, 48h) transfected cells were evaluated for mitochondrial membrane potential and integrity using JCI (I) and for mitochondrial number using mitochondrial short d-loop specific primers by qRT-PCR. β-2 microglobulin was used as normalization control (J). (K) Glycolytic rates in scramble and H19 siRNA transfected cells were assessed in the presence of glucose (10 mM), oligomycin (2 μM) and 2-Deoxy-d-glucose (100 mM). Glycolysis, glycolytic capacity and glycolytic reserve as determined are presented. All experiments were done thrice and data are presented are means ± SEM.**p < 0.01, *p < 0.05, ns: non-significant. (For interpretation of the references to color in this figure legend, the reader is referred to the Web version of this article.)
3.4. Downregulation of H19 increases gluconeogenic genes’ levels in Hepa1-6 cells
Results as above suggest that inhibition of H19 expression promotes mitochondrial dysfunction that might contribute to aberrant hepatic physiology. Two major hepatic hallmarks during diabetes, namely increased lipid accumulation and gluconeogenesis were evaluated towards physiological relevance. As compared to scramble, H19 siRNA did not depict any change in either lipid accumulation as evaluated by Bodipy staining (Fig. 4A) or in the expression of transcript levels of lipid and cholesterol metabolism genes, namely Fasn, Hadha, Acadl, Hmgcs and Hmgcr, although Dgat2 transcript levels were modestly increased (Fig. 4B). Interestingly, as compared to scramble, expression levels of all the gluconeogenic genes, namely G6Pase, FBP1, PCK1 and PCx were significantly increased in the presence of H19 siRNA, both at the transcript and protein levels (Fig. 4C–G).
Fig. 4.

Effects of H19 inhibition on genes of fatty acid and cholesterol metabolism and gluconeogenesis in Hepa 1–6 cells. (A) Hepa 1–6 cells were transfected with either the scramble or H19 siRNA (5 nM, 48 h) and total cellular lipid content was evaluated using Bodipy. Total RNA isolated from Hepa 1–6 cells transfected as in “A” was reverse transcribed and assessed for the relative transcript expression of genes of fatty acid and cholesterol metabolism, namely Fasn, Dgat2, Hmgcr, Hmgcs, Acadl, Hadha (B) and gluconeogenesis, namely G6Pase, Pcx, Fbp1 and Pck1 (C). Cells transfected as in “A” were lysed and lysates (20–40 μg) were resolved on SDS-PAGE, transferred to nitrocellulose membranes and probed with antibodies against G6Pase (D), FBP1 (E), PCK1 (F) and PCx (G). β-actin or Vinculin were used as the loading controls and densitometric analyses are given in the panels below. All experiments were done at least three times and data are presented as means ± SEM.**p < 0.01, *p < 0.05, ns: non-significant.
3.5. Increasing VDAC1 levels alone lead to mitochondrial dysfunction and increase in the expresssion of gluconeogenic genes
Having demonstrated a major role of H19 inhibition on VDAC1 increase and in promoting hepatic gluconeogenesis, we attempted to explore if overexpression of VDAC1 alone is sufficient to impair mitochondria function and promote gluconeogenesis. The full length mouse VDAC1 clone was overexpressed in Hepa 1–6 cells. Transfection of the VDAC1 at doses of 0.5–1 μg led to increased expression of VDAC1 levels as compared to the vector control (Fig. 5A). VDAC1 overexpression is associated with induction of apoptosis [36,37]; however, in our study while 0.5 μg did not show any apoptosis, there was a modest but significant increase in apoptosis at a dose of 1 μg of VDAC1 clone (Fig. 5B). Increased VDAC1 expression was associated with significant increases in the expression of protein levels of gluconeogenic genes (G6Pase, PCK1, FBP1 and PCx) and hepatic glucose output at 1 μg concentration of the VDAC1 clone, although significant increase in FBP1 levels was also additionally observed at 0.5 μg of the VDAC1 clone (Fig. 5C–G). Concomitantly, there was increased mitochondrial calcium and ROS levels, although cytosolic calcium levels were not altered (Fig. 5H–J). As compared to vector control, overexpression of VDAC1 alone caused a significant reduction in basal and maximal respiration, proton leak, spare respiratory capacity and ATP production in Hepa 1–6 cells (Fig. 5K), all suggesting that VDAC1 overexpression alone is enough to impair mitochondrial function and increase hepatic gluconeogenesis.
Fig. 5.

Overexpression of VDAC1 increases gluconeogenic genes and impairs mitochondrial function in Hepa 1–6 cells. Hepa 1–6 cells were transfected with either the empty vector or the VDAC1 overexpression clone (0.5 and 1 μg). At 48h, cells were lysed and lysates (20 μg) were probed for the levels of VDAC1 (A). (B) Hepa 1–6 cells were transfected as in “A” and on completion of incubation, cells were washed and labelled with annexin V and Propidium Iodide (PE) and analyzed for apoptosis by flow cytometry. Annexin V (FITC-A) positive cells are represented. Hepa 1–6 cells transfected with either the empty vector or the VDAC1 overexpression clone (0.5 and 1 μg) were lysed and lysates (20–40 μg) were probed to evaluate G6Pase (C), PCx (D), PCK1 (E) and FBP1 (F) protein levels by Western Blot analysis. β-actin or Vinculin were used as loading controls. Representative blots are shown and densitometric analyses (n = 3) are given in the panels below. (G) Hepa 1–6 cells transfected with either the empty vector or the VDAC1 clone (1 μg) were incubated in the presence of sodium lactate (20 mM) and sodium pyruvate (2 mM) and glucose output into the media was measured. Data was normalized to the protein content. Cells transfected as in “C” were analyzed for mitochondrial Ca2+ levels using Rhod-2 AM (1 μM) (H), cytosolic Ca2+ levels using Fluo-3 AM (1 μM) (I) and mitochondrial ROS (J). (K) Representative OCR of Hepa 1–6 cells after transfection with either the empty vector or the VDAC1 clone (1 μg) for 48h in the presence of 2 μM oligomycin, 1.25 μM FCCP and 2 μM rotenone and 2 μM antimycin and quantitative analysis of basal respiration, maximal respiration, proton leak, spare respiratory capacity and ATP production. Experiments were performed thrice and data are presented as means ± SEM. ***p < 0.001, **p < 0.01, *p < 0.05, ns: non-significant.
3.6. H19 inhibition or VDAC1 overexpression increases JNK phosphorylation and abrogates insulin signaling in Hepa1-6 cells
To further investigate the effect of H19-VDAC1 axis on increased gluconeogenesis, we evaluated the activation of MAPKs in the presence of H19 siRNA and as compared to scramble transfected cells, there was a significant increase in the levels of p-JNK1/2; however, the total JNK1/2 levels remained unchanged (Fig. 6A) and p-p38 and p-ERK1/2 levels did not depict any change in the presence of H19 siRNA (Fig. 6B and C). Increased JNK1/2 activation is reported to increase serine (Ser307) phosphorylation of IRS1 and subsequently impair insulin signaling [[38], [39], [40]]. Increased p-JNK1/2 levels in the presence of H19 siRNA was accompanied by increased IRS1(Ser307) phosphorylation (Fig. 6D) and abrogation of insulin-stimulated AKT phosphorylation (Ser473) (Fig. 6E). Concomitant with these, VDAC1 overexpression alone sufficiently increased p-JNK1/2 (Fig. 6F) and p-IRS1(Ser307) levels (Fig. 6G) along with dampening of insulin-stimulated AKT phosphorylation (Ser473) (Fig. 6H) and glucose uptake (Fig. 6I) in Hepa1-6 cells.
Fig. 6.

H19 inhibition or upregulation of VDAC1 increases JNK phosphorylation and abrogates insulin signaling in Hepa 1–6 cells. Hepa 1–6 cells transfected with either the scramble or H19 siRNA (5 nM, 48h) were lysed and protein lysates were evaluated for the protein levels of p-JNK1/2/JNK1/2 (A), p-p38/p38 (B), p-ERK1/2/ERK1/2 (C) and p-IRS1(Ser307)/IRS1 (D). (E) Cells transfected as “A” were incubated in the absence or presence of insulin (10 nM, 30 min). On termination of incubation, cells were lysed and probed for the levels of p-AKT and AKT by Western Blot analysis. Hepa 1–6 cells were transfected with either the empty vector or the VDAC1 overexpression clone (0.5 and 1 μg). At 48h, cells were lysed and lysates (20–40 μg) were probed for the protein levels p-JNK1/2/JNK1/2 (F) and p-IRS1(Ser307)/IRS1(G). (H) Cells transfected as “F” were incubated in the absence or presence of insulin (10 nM, 30 min), lysed and probed for the protein levels of p-AKT and AKT. HSC70, β-actin or vinculin were used as loading controls. Representative densitometric blots are given and the densitometric analyses are given below. (I) Hepa 1–6 cells transfected with either the empty vector or the VDAC1 clone (1 μg) were incubated in the absence or presence of insulin (10 nM, 30 min) and glucose levels were measured using 2-NBDG as described in the “Methods” section. Experiments were done three times and data are presented as means ± SEM.***p < 0.001, **p < 0.01, *p < 0.05, ns: non-significant.
3.7. Effects of H19 inhibition are rescued by downregulation of VDAC1
To explore if inhibition of H19 expression effects are mediated through VDAC1, Hepa 1–6 cells were cotransfected with H19 and VDAC1 siRNAs and with VDAC1 levels showing significant decreased expression in the presence of VDAC1 siRNA (5–20 nM) (Fig. 7A), the effects of H19 siRNA on PCK1, G6Pase, FBP1, p-JNK1/2 and p-IRS1 (Ser307) were significantly rescued (Fig. 7B–F). Also, H19 siRNA induced increase in ER-mitochondrial contact and impairment in mitochondrial function as assessed by OCR were significantly recovered in the presence of VDAC1 siRNA (Fig. 7G and H). All these indicate that the H19-VDAC1 axis is important in altered mitochondrial function and elevated hepatic gluconeogenesis as seen during diabetes. These were additionally validated using metformin, a commonly used antidiabetic medication that acts by inhibiting VDAC1 levels [41]. As compared to control, Hepa 1–6 cells incubated with metformin showed a dose-dependent decrease in VDAC1 protein expression (Fig. 8A). However, metformin had no effects on the transcript levels of H19 (Fig. 8B), although H19 siRNA mediated increases in ER-mitochondria contact and in transcript expression of G6pase, Pck1, Fbp1 and Pcx were significantly prevented by metformin (Fig. 8C–G). These substantiate the mediatory role of VDAC1 in the detrimental effects of H19 inhibition.
Fig. 7.

VDAC1 inhibition rescues H19 siRNA mediated effects in Hepa1-6 cells. (A) Hepa 1–6 cells were transfected with either the scramble or VDAC1 siRNA (5–20 nM) for 48h, lysed and probed for the levels of VDAC1 by Western Blot analysis. Hepa 1–6 cells were co-transfected with H19 siRNA (5 nM) and VDAC1 siRNA (5 nM) and after 48h, the levels of PCK1 (B), G6Pase (C), FBP1 (D), p-JNK1/2/JNK1/2 (E) and p-IRS1(Ser307)/IRS1 (F) were evaluated by Western Blot analyses using specific antibodies. Vinculin or HSC70 was used as the loading control. Representative blots are shown and densitometric analyses of three blots are given in the panels below. (G) Hepa 1–6 cells transfected as in “A” were subjected to in-situ proximity ligation assay using anti-VDAC1 and anti-IP3R antibodies. Representative confocal images of the cells are shown and the interaction between IP3R and VDAC1 is indicated by red dots. Nuclei are indicated by blue staining using DAPI. Quantification of IP3R-VDAC1 interactions is depicted by red blobs per nucleus. Scale: 20 μm; Magnification: 60X. At least five images were captured per incubation. (H) OCR in the presence of 2 μM oligomycin (ATP synthase inhibitor), 1.25 μM FCCP (uncoupling agent) and 2 μM rotenone and 2 μM antimycin (complex I and III inhibitors, respectively) of Hepa 1–6 cells transfected as in “A”. Basal respiration, maximal respiration, proton leak, spare respiratory capacity and ATP production were determined as described in the “Materials and Methods” section. Experiments were done three times and data presented as means ± SEM. ***p < 0.001, **p < 0.01, *p < 0.05. (For interpretation of the references to color in this figure legend, the reader is referred to the Web version of this article.)
Fig. 8.

Metformin rescues H19 siRNA mediated effects in Hepa1-6 cells. (A) Hepa 1–6 cells were incubated either without (Control) or with metformin (20–1000 μM) for 42h; after competition of incubation, total RNA was isolated and subjected to qRT-PCR using VDAC1 (A) or H19 (B) specific primers. 18S rRNA was used as the normalization control. Hepa 1–6 cells were transfected with either scramble or H19 siRNA (5 nM) in the presence or absence of metformin (1000 μM) for 42h; after competition of incubation, total RNA was isolated and subjected to qRT-PCR to determine the transcript levels of Fbp1 (C), G6Pase (D), Pcx (E) and Pck1(F). 18S rRNA was used as the normalization control. (G) Hepa 1–6 cells transfected as in “C” were subjected to in-situ proximity ligation assay using anti-VDAC1 and anti-IP3R antibodies. Representative confocal images of the cells are shown and the interaction between IP3R and VDAC1 is indicated by red dots. Nuclei are indicated by blue staining using DAPI. Quantification of IP3R-VDAC1 interactions is represented by red blobs per nucleus. Scale: 20 μm; Magnification: 60X. At least five images were captured per incubation. Each data point is the mean of three independent experiments and is presented as means ± SEM. ***p < 0.001, **p < 0.01, *p < 0.05. ns: non-significant (For interpretation of the references to color in this figure legend, the reader is referred to the Web version of this article.)
3.8. H19 inhibition in vivo increases hepatic VDAC1 and gluconeogenic genes’ levels in mice
It was described previously from our laboratory that in-vivo administration of H19 siRNA induced hyperglycemia and impaired oral and insulin tolerance in mice [32]. While following results in Hepa 1–6 cells where H19 inhibition increased VDAC1 and gluconeogenic genes' levels, similar patterns of expression were observed in H19 siRNA administered mice where as compared to scramble injected mice (C57BL/6J), H19 siRNA caused a significant inhibition of expression of hepatic H19 (Fig. 9A). This was accompanied by increased expression of VDAC1 (Fig. 9B and C) and an increase in the transcript levels of gluconeogenic genes, namely, G6pase, Pck1, Pcx and Fbp1 in H19 siRNA injected mice has already been reported in a previous report from our laboratory [32]. As compared to scramble injected mice, hepatic levels of p-JNK1/2 and p-IRS1 (Ser 307) were significantly increased in H19 siRNA injected mice (Fig. 9D and E). Such elevated levels of IRS1 phosphorylation at Ser 307 in H19 siRNA administered mice were associated with decreased p-Akt levels (Ser473) (Fig. 9F) that are suggestive of impaired basal insulin sensitivity within the livers of these mice. These data suggest a critical role of the H19-VDAC1 axis in increased JNK1/2 phosphorylation, IRS1 (Ser307) phosphorylation, impaired insulin signaling and increased gluconeogenic genes’ expression in the liver.
Fig. 9.

In-vivo H19 antagonism upregulates VDAC1 and promotes JNK and IRS1 (Ser 307) phosphorylation. As described in a previous study, mice were injected (i.v) with either the scramble or H19 siRNA (3 mg/kg body weight). Total RNA was isolated from the liver tissues, reverse transcribed and the levels of H19 (A) and Vdac1 (B) were analyzed by qRT-PCR. 18S rRNA was taken as the normalization control. (C) Mice liver tissues were homogenised and the levels of VDAC1 (C), pJNK1/2/JNK1/2 (D), pIRS1(Ser307)/IRS1(E) and pAKT/AKT (F) were assessed by Western Blot analysis using specific antibodies. Vinculin, HSC70 or β-actin were used as loading controls. Each data point is the mean of values from at least three animals and are presented as means ± SEM.***p < 0.001, *p < 0.05.
4. Discussion
In the present study we sought to explore the effects of the lncRNA, H19 inhibition on ER-mitochondria communication and the potential consequent implications in manifesting hepatic insulin resistance. Close contacts between the ER and the mitochondria maintained by MAM proteins regulate diverse cellular processes including calcium homeostasis, lipid metabolism, unfolded protein response, mitochondrial dynamics, etc [6,42]. Our data show that levels of several MAM proteins are altered in the livers of diabetic mice, suggesting of a possible correlation to hepatic insulin resistance. Such altered levels of MAM proteins within the livers of several diabetic mice models have been reported [11,14] and impaired ER-mitochondria contact is believed to be a causal trigger for hepatic insulin resistance [43]. Several regulatory events may underlie such patterns of impaired ER-mitochondria interactions due to altered levels of MAM proteins. Here, we show that levels of H19 that are significantly down-regulated in the livers of diabetic db/db mice [29], majorly increases VDAC1, both at the transcript and protein levels. VDAC1 activities are known to be modulated by varied proteins, Ca2+, ATP, glutamate, and NADH [[44], [45], [46], [47]]. VDAC1 is an approximately 32 kDa protein and primarily expressed on the outer mitochondrial membrane. It acts as a gatekeeper for the mitochondrial passage of Ca2+, metabolites, ions and is significant in regulating apoptosis by virtue of its interaction with apoptotic and anti-apoptotic proteins [48,49] together with being a necessary component of the cholesterol transport multi-protein complex that also comprises of the translocator protein (TSPO), and the steroidogenic acute regulatory protein (STAR) [50,51]. In addition, by being physically connected to IP3R on the ER through GRP75, it contributes in maintenance of ER-mitochondria communication. VDAC1 being an essential component of the mitochondria and important for diverse aspects of mitochondria function, has been implicated in cancer [52,53], Alzheimer's disease [[54], [55], [56]], T2D [41,57,58], autoimmune diseases such as lupus [59], non-alcoholic fatty liver disease [50] and cardiovascular diseases [60]. Corroborating these deleterious effects, our data show that increased VDAC1 due to H19 inhibition increases ER-mitochondria contact, elevates mitochondrial Ca2+ and ROS levels, while impairing total ATP production and mitochondrial respiration in Hepa 1–6 cells. Similar increases in ER-mitochondria contact along with impaired mitochondrial parameters in the livers of HFD and ob/ob mice has been reported [11].
Abnormal ER-mitochondria interactions within the liver are frequently associated with aberrant lipid and glucose metabolic pathways [61]. These interactions can interfere with several cellular signaling pathways and consequently affect glucose homeostasis or do so by independently regulating ER and mitochondria function [62]. Phospholipids, for example, phosphatidylserine synthesized in the ER is transferred into mitochondria and such phosphatidylserine transfer at the MAM interface is mediated by proteins localized at MAMs. MAMs contain enzymes required for cholesterol and ceramide biosynthesis, making MAMs enriched in cholesterol and sphingolipids [8]. All these are suggestive of MAMs being significant in cellular lipid homeostasis and aberrant ER-mitochondria contacts being one of the underlying causes of deregulated lipid metabolism. However, we did not observe any effect of H19 inhibition on either lipid deposition or the transcript levels of lipid and cholesterol metabolism genes, suggesting that H19 inhibition alone even with affecting VDAC1 levels, possibly does not exert effects on lipid metabolism. On the other hand, Liu et al. [63] demonstrated attenuation of free-fatty acid mediated lipid accumulation by H19 inhibition in liver cells and silencing endogenous H19 exerted differential effects on genes involved in lipid synthesis, storage and breakdown at 36h versus 72h of transfection in hepatocytes [64]. All these suggest debatable effects of H19 on lipid metabolism depending on the extent and duration of H19 inhibition within cells.
Along with aberrant hepatic lipid metabolism, impaired hepatic glucose metabolism is also a significant feature associated during diabetes. Both, the ER and mitochondria independently and also together are important in the maintenance of intracellular Ca2+ homeostasis, Ca2+ signaling and in the control of hepatic glucose metabolism, specifically glucose production and glycogenolysis [61,65]. Our results show that both, H19 inhibition and VDAC1 overexpression significantly elevated the levels of gluconeogenic genes in Hepa 1–6 cells. Additionally, VDAC1 upregulation alone also increased mitochondrial Ca2+ and ROS levels and reduced mitochondrial respiration in Hepa 1–6 cells. In-vivo knockdown of H19 in mice led to increased hepatic VDAC1 expression, increased pJNK and pIRS1(Ser 307) levels; increased expression of hepatic gluconeogenic genes in such mice together with increased levels of FoxO1, possibly due to increased occupancy of p53 on the FoxO1 promoter has been reported [32]. H19 acts as a sponge for let-7b and increases the expression of FoxO1 together with FoxO1 phosphorylation [66]. On the other hand, Wu et al. have demonstrated that H19 overexpression increased the expression of PCK and gluconeogenesis by promoting nuclear retention of FoxO1 [67] and increasing HNF4α levels [68,69]. H19 is highly expressed in the skeletal muscle and H19 knockdown increases the myoblast-inhibitory genes Sirt1/FoxO1 during myogenesis and differentiation of bovine skeletal muscle satellite cells [70]. In C2C12 cells, H19 inhibition has been shown to dampen insulin-stimulated IRS1 and Akt phosphorylation [71] and by targeting hnRNPA, H19 promotes fatty acids oxidation and ameliorates skeletal muscle insulin resistance [72]. H19 expression is decreased in the muscles of insulin-resistant human subjects and high-fat diet fed rodents and mice with genetic H19 ablation exhibit muscle insulin resistance. The dual-specificity phosphatase DUSP27/DUPD1 was identified as a potential important downstream effector of H19 and by activating AMPK, H19 was shown to enhance insulin sensitivity [20]. These suggest that H19 levels are critical in diverse aspects of metabolism and with increased hepatic glucose production being a major pathophysiological event in type 2 diabetic subjects [73], our study implicates an important role of the H19-VDAC1 axis mediated ER-mitochondria miscommunication in modulating hepatic gluconeogenesis.
At the molecular level, we observed that while H19 inhibition significantly increased the activation of JNK1/2, that of ERK1/2 and p38 remained unchanged. Similar crosstalk between JNK and lncRNAs underlie the pathogenesis of a wide spectrum of disorders like cardiovascular diseases, bone and kidney disorders, etc. [74]. MAPKs (Mitogen-activated protein kinases) are a group of ubiquitous family of proteins that are activated in response to cellular stress, development changes and cellular metabolism. They play major roles in regulating hepatic metabolic processes, increasing ROS production and altering Ca2+ levels and conditions like high fat diet, obesity and NASH have been shown to activate JNK and p38 MAPK pathways in the liver [38,[75], [76], [77], [78]]. Increased JNK activation promotes Ser307 phosphorylation of IRS1 that dampens insulin signaling and decreases insulin sensitivity [[38], [39], [40]]. Our data show that H19 inhibition, in addition to increasing JNK1/2 phosphorylation also increases IRS1(Ser307) phosphorylation and this prevents insulin stimulated activation of the signaling cascade and abrogates insulin signaling in Hepa 1–6 cells. A previous study from our laboratory had also shown that while H19 inhibition impairs insulin action, its overexpression increases insulin sensitivity in HepG2 cells [29,32]. Interestingly, VDAC1 inhibition significantly rescued almost all deleterious effects of H19 inhibition, suggesting VDAC1 as a significant mediator. Similar beneficial effects of VDAC1 inhibition have been reported where VDAC1 inhibitors such as VBIT-4 reduce neuro inflammation and apoptosis in Alzheimer's disease [79] and VBIT-4 alongwith other drugs such as AKOS-022 prevent VDAC1 oligomerization, mitochondrial dysfunction and apoptosis [80]. Inhibition of VDAC1 by metformin prevents mitochondrial dysfunction and apoptosis in T2D diabetic mice models [41] and R-Tf-D-LP4, a mitochondrial VDAC1 interacting and inhibiting peptide increases fatty acid oxidation, which prevents steatosis and NASH, reduces hepatic lipid accumulation, inflammation and gluconeogenesis [50,81].
Taken together, our study reveals a significant role of the lncRNA, H19-VDAC1 axis in ER-mitochondria miscommunication in the liver during diabetes. Several controversies exist regarding the nature of the hepatic MAM complex, its content and status during diabetes and these possibly are due to the highly dynamic and plastic nature of the MAM complex that critically depends on the age, stress, diet, metabolic status, etc. Nonetheless, impaired hepatic ER-mitochondria contact is a significant hallmark during diabetes and therapeutic intervention at these contacts offers a potential approach in addressing the complicacies associated with metabolic diseases.
Funding
This work was supported by the Indian Council of Medical Research, New Delhi, India (GAP0203). A.N and S.R acknowledge the Department of Biotechnology and University Grants Commission, New Delhi, India for their fellowships.
Authors contributions
M.D conceived and designed the experiments; A.N and S.R standardized and performed the experiments; A.N and M.D analyzed the data and wrote the paper.
Prior presentation
Parts of this study were presented at the International Conference on Calcium Signaling: Regulatory mechanisms to impact on health and diseases held at Regional Centre for Biotechnology, Faridabad, India from January 31-February 1, 2020.
Declaration of competing interest
None.
Acknowledgements
We wish to thank the Animal House and Confocal Imaging facilities at CSIR-IGIB for facilitating the experiments. We thank Dr. Himanshi Kapoor for her help in the imaging experiments.
Data availability
Data will be made available on request.
References
- 1.Yoshida H. ER stress and diseases. FEBS J. 2007;274(3):630–658. doi: 10.1111/j.1742-4658.2007.05639.x. [DOI] [PubMed] [Google Scholar]
- 2.Pieczenik S.R., Neustadt J. Mitochondrial dysfunction and molecular pathways of disease. Exp. Mol. Pathol. 2007;83(1):84–92. doi: 10.1016/j.yexmp.2006.09.008. [DOI] [PubMed] [Google Scholar]
- 3.Phillips M.J., Voeltz G.K. Structure and function of ER membrane contact sites with other organelles. Nat. Rev. Mol. Cell Biol. 2016;17(2):69–82. doi: 10.1038/nrm.2015.8. [DOI] [PMC free article] [PubMed] [Google Scholar]
- 4.Gyorgy C., Weaver D., Gyorgy Hajnoczky. ER-mitochondrial contact-ology: structure and signaling functions. Physiol. Behav. 2017;176(1):100–106. [Google Scholar]
- 5.López-Crisosto C., Bravo-Sagua R., Rodriguez-Peña M., Mera C., Castro P.F., Quest A.F.G., et al. ER-to-mitochondria miscommunication and metabolic diseases. Biochim. Biophys. Acta, Mol. Basis Dis. 2015;1852(10):2096–2105. doi: 10.1016/j.bbadis.2015.07.011. [DOI] [PubMed] [Google Scholar]
- 6.Doghman-Bouguerra M., Lalli E. ER-mitochondria interactions: both strength and weakness within cancer cells. Biochim. Biophys. Acta Mol. Cell Res. 2019;1866(4):650–662. doi: 10.1016/j.bbamcr.2019.01.009. [DOI] [PubMed] [Google Scholar]
- 7.Mao H., Chen W., Chen L., Li L. Potential role of mitochondria-associated endoplasmic reticulum membrane proteins in diseases. Biochem. Pharmacol. 2022;199(March) doi: 10.1016/j.bcp.2022.115011. [DOI] [PubMed] [Google Scholar]
- 8.Raturi A., Simmen T. Where the endoplasmic reticulum and the mitochondrion tie the knot: the mitochondria-associated membrane (MAM) Biochim. Biophys. Acta Mol. Cell Res. 2013;1833(1):213–224. doi: 10.1016/j.bbamcr.2012.04.013. [DOI] [PubMed] [Google Scholar]
- 9.Yang S., Zhou R., Zhang C., He S., Su Z. Mitochondria-associated endoplasmic reticulum membranes in the pathogenesis of type 2 diabetes mellitus. Front. Cell Dev. Biol. 2020 Oct 20;8 doi: 10.3389/fcell.2020.571554. [DOI] [PMC free article] [PubMed] [Google Scholar]
- 10.Merkwirth C., Langer T. Mitofusin 2 builds a bridge between ER and mitochondria. Cell. 2008 Dec 26;135(7):1165–1167. doi: 10.1016/j.cell.2008.12.005. [DOI] [PubMed] [Google Scholar]
- 11.Arruda A.P., Pers B.M., Parlakgül G., Güney E., Inouye K., Hotamisligil G.S. Chronic enrichment of hepatic endoplasmic reticulum-mitochondria contact leads to mitochondrial dysfunction in obesity. Nat. Med. 2014 Dec;20(12):1427–1435. doi: 10.1038/nm.3735. [DOI] [PMC free article] [PubMed] [Google Scholar]
- 12.Krzysiak T.C., Thomas L., Choi Y.J., Auclair S., Qian Y., Luan S., et al. An insulin-responsive sensor in the SIRT1 disordered region binds DBC1 and PACS-2 to control enzyme activity. Mol. Cell. 2018 Dec 20;72(6):985–998.e7. doi: 10.1016/j.molcel.2018.10.007. [DOI] [PMC free article] [PubMed] [Google Scholar]
- 13.Yang S., Zhou R., Zhang C., He S., Su Z. Mitochondria-associated endoplasmic reticulum membranes in the pathogenesis of type 2 diabetes mellitus. Front. Cell Dev. Biol. 2020 Oct 20;8:935. doi: 10.3389/fcell.2020.571554. [DOI] [PMC free article] [PubMed] [Google Scholar]
- 14.Tubbs E., Theurey P., Vial G., Bendridi N., Bravard A., Chauvin M.A., et al. Mitochondria-associated endoplasmic reticulum membrane (MAM) integrity is required for insulin signaling and is implicated in hepatic insulin resistance. Diabetes. 2014 Oct;63(10):3279–3294. doi: 10.2337/db13-1751. [DOI] [PubMed] [Google Scholar]
- 15.Tubbs E., Chanon S., Robert M., Bendridi N., Bidaux G., Chauvin M.A., et al. Disruption of mitochondria-associated endoplasmic reticulum membrane (MAM) integrity contributes to muscle insulin resistance in mice and humans. Diabetes. 2018;67(4):636–650. doi: 10.2337/db17-0316. [DOI] [PubMed] [Google Scholar]
- 16.Rieusset J., Fauconnier J., Paillard M., Belaidi E., Tubbs E., Chauvin M.-A., et al. Disruption of calcium transfer from ER to mitochondria links alterations of mitochondria-associated ER membrane integrity to hepatic insulin resistance. Diabetologia. 2016 Mar 10;59(3):614–623. doi: 10.1007/s00125-015-3829-8. [DOI] [PubMed] [Google Scholar]
- 17.Chen Y., Li S., Zhang Y., Wang M., Li X., Liu S., et al. The lncRNA Malat1 regulates microvascular function after myocardial infarction in mice via miR-26b-5p/Mfn1 axis-mediated mitochondrial dynamics. Redox Biol. 2021 May 1:41. doi: 10.1016/j.redox.2021.101910. [DOI] [PMC free article] [PubMed] [Google Scholar]
- 18.Zhou X., Zhang L., Zheng B., Yan Y., Zhang Y., Xie H., et al. MicroRNA-761 is upregulated in hepatocellular carcinoma and regulates tumorigenesis by targeting Mitofusin-2. Cancer Sci. 2016;107(4):424–432. doi: 10.1111/cas.12904. [DOI] [PMC free article] [PubMed] [Google Scholar]
- 19.Sultan H.K., El-Ayat W.M., AbouGhalia A.H., Lasheen N.N., Moustafa A.S. Study of long non-coding RNA and mitochondrial dysfunction in diabetic rats. Tissue Cell. 2021 Aug 1:71. doi: 10.1016/j.tice.2021.101516. [DOI] [PubMed] [Google Scholar]
- 20.Geng T., Liu Y., Xu Y., Jiang Y., Zhang N., Wang Z., et al. H19 lncRNA promotes skeletal muscle insulin sensitivity in part by targeting AMPK. Diabetes. 2018 Nov 1;67(11):2183–2198. doi: 10.2337/db18-0370. [DOI] [PMC free article] [PubMed] [Google Scholar]
- 21.Li X., Wang H., Yao B., Xu W., Chen J., Zhou X. LncRNA H19/miR-675 axis regulates cardiomyocyte apoptosis by targeting VDAC1 in diabetic cardiomyopathy. Sci. Rep. 2016;6(July):1–9. doi: 10.1038/srep36340. [DOI] [PMC free article] [PubMed] [Google Scholar]
- 22.Wang Y., Hylemon P.B., Zhou H. Long noncoding RNA H19: a key player in liver diseases. Hepatology. 2021 Sep 1;74(3):1652–1659. doi: 10.1002/hep.31765. [DOI] [PMC free article] [PubMed] [Google Scholar]
- 23.Bartolomei M.S., Zemel S., Tilghman S.M. Parental imprinting of the mouse H19 gene. Nature. 1991;351(6322):153–155. doi: 10.1038/351153a0. [DOI] [PubMed] [Google Scholar]
- 24.Keniry A., Oxley D., Monnier P., Kyba M., Dandolo L., Smits G., et al. The H19 lincRNA is a developmental reservoir of miR-675 that suppresses growth and Igf1r. Nat. Cell Biol. 2012 Jul;14(7):659–665. doi: 10.1038/ncb2521. [DOI] [PMC free article] [PubMed] [Google Scholar]
- 25.Matouk I.J., DeGroot N., Mezan S., Ayesh S., Abu-Lail R., Hochberg A., et al. The H19 non-coding RNA is essential for human tumor growth. PLoS One. 2007 Sep 5;2(9):e845. doi: 10.1371/journal.pone.0000845. [DOI] [PMC free article] [PubMed] [Google Scholar]
- 26.Jiang Y., Zhu H., Chen Z., Yu Y.C., Guo X.H., Chen Y., et al. Hepatic IGF2/H19 epigenetic alteration induced glucose intolerance in gestational diabetes mellitus offspring via FoxO1 mediation. Front. Endocrinol. 2022 Apr 1;13 doi: 10.3389/fendo.2022.844707. [DOI] [PMC free article] [PubMed] [Google Scholar]
- 27.Kallen A.N., Zhou X.B., Xu J., Qiao C., Ma J., Yan L., et al. The imprinted H19 lncRNA antagonizes let-7 microRNAs. Mol. Cell. 2013 Oct 10;52(1):101–112. doi: 10.1016/j.molcel.2013.08.027. [DOI] [PMC free article] [PubMed] [Google Scholar]
- 28.Gao Y., Wu F., Zhou J., Yan L., Jurczak M.J., Lee H.Y., et al. The H19/let-7 double-negative feedback loop contributes to glucose metabolism in muscle cells. Nucleic Acids Res. 2014 Dec 16;42(22):13799–13811. doi: 10.1093/nar/gku1160. [DOI] [PMC free article] [PubMed] [Google Scholar]
- 29.Goyal N., Sivadas A., Shamsudheen K.V., Jayarajan R., Verma A., Sivasubbu S., et al. RNA sequencing of db/db mice liver identifies lncRNA H19 as a key regulator of gluconeogenesis and hepatic glucose output. Sci. Rep. 2017;7(1):1–12. doi: 10.1038/s41598-017-08281-7. [DOI] [PMC free article] [PubMed] [Google Scholar]
- 30.Wang Y., An H., Liu T., Qin C., Sesaki H., Guo S., et al. Metformin improves mitochondrial respiratory activity through activation of AMPK. Cell Rep. 2019;29(6):1511–1523.e5. doi: 10.1016/j.celrep.2019.09.070. [DOI] [PMC free article] [PubMed] [Google Scholar]
- 31.Rogers G.W., Brand M.D., Petrosyan S., Ashok D., Elorza A.A., Ferrick D.A., et al. High throughput microplate respiratory measurements using minimal quantities of isolated mitochondria. PLoS One. 2011;6(7) doi: 10.1371/journal.pone.0021746. [DOI] [PMC free article] [PubMed] [Google Scholar]
- 32.Goyal N., Tiwary S., Kesharwani D., Datta M. Long non-coding RNA H19 inhibition promotes hyperglycemia in mice by upregulating hepatic FoxO1 levels and promoting gluconeogenesis. J Mol Med. 2019;97(1):115–126. doi: 10.1007/s00109-018-1718-6. [DOI] [PubMed] [Google Scholar]
- 33.Magrì A., Reina S., De Pinto V. VDAC1 as pharmacological target in cancer and neurodegeneration: focus on its role in apoptosis. Front. Chem. 2018 Apr 1;6(APR) doi: 10.3389/fchem.2018.00108. [DOI] [PMC free article] [PubMed] [Google Scholar]
- 34.Camara A.K.S., Zhou Y.F., Wen P.C., Tajkhorshid E., Kwok W.M. Mitochondrial VDAC1: a key gatekeeper as potential therapeutic target. Front. Physiol. 2017 Jun 30;8(JUN) doi: 10.3389/fphys.2017.00460. [DOI] [PMC free article] [PubMed] [Google Scholar]
- 35.Arbel N., Ben-Hail D., Shoshan-Barmatz V. Mediation of the antiapoptotic activity of Bcl-xL protein upon interaction with VDAC1 protein. J. Biol. Chem. 2012 Jun 29;287(27):23152–23161. doi: 10.1074/jbc.M112.345918. [DOI] [PMC free article] [PubMed] [Google Scholar]
- 36.Weisthal S., Keinan N., Ben-Hail D., Arif T., Shoshan-Barmatz V. Ca(2+)-mediated regulation of VDAC1 expression levels is associated with cell death induction. Biochim. Biophys. Acta. 2014;1843(10):2270–2281. doi: 10.1016/j.bbamcr.2014.03.021. [DOI] [PubMed] [Google Scholar]
- 37.Keinan N., Tyomkin D., Shoshan-Barmatz V. Oligomerization of the mitochondrial protein voltage-dependent anion channel is coupled to the induction of apoptosis. Mol. Cell Biol. 2010;30(24):5698–5709. doi: 10.1128/MCB.00165-10. [DOI] [PMC free article] [PubMed] [Google Scholar]
- 38.Wellen K.E., Hotamisligil G.S., Wellen K.E., Hotamisligil G.S. Inflammation , stress , and diabetes. 2005;115(5):1111–1119. doi: 10.1172/JCI25102. [DOI] [PMC free article] [PubMed] [Google Scholar]
- 39.Feng J., Lu S., Ou B., Liu Q., Dai J., Ji C., et al. The role of JNk signaling pathway in obesity-driven insulin resistance. Diabetes, Metab Syndr Obes. 2020 Apr 29;13:1399–1406. doi: 10.2147/DMSO.S236127. [DOI] [PMC free article] [PubMed] [Google Scholar]
- 40.Hirosumi J., Tuncman G., Chang L., Görgün C.Z., Uysal K.T., Maeda K., et al. A central role for JNK in obesity and insulin resistance. Nat. 2002 Nov 21;420(6913):333–336. doi: 10.1038/nature01137. 2002 4206913. [DOI] [PubMed] [Google Scholar]
- 41.Zhang E., Mohammed Al-Amily I., Mohammed S., Luan C., Asplund O., Ahmed M., et al. Preserving insulin secretion in diabetes by inhibiting VDAC1 overexpression and surface translocation in β cells. Cell Metabol. 2019;29(1):64–77.e6. doi: 10.1016/j.cmet.2018.09.008. [DOI] [PMC free article] [PubMed] [Google Scholar]
- 42.Tubbs E., Rieusset J. Metabolic signaling functions of ER–mitochondria contact sites: role in metabolic diseases. J. Mol. Endocrinol. 2017;58(2):R87–R106. doi: 10.1530/JME-16-0189. [DOI] [PubMed] [Google Scholar]
- 43.Beaulant A., Dia M., Pillot B., Chauvin M.A., Ji-cao J., Durand C., et al. Endoplasmic reticulum-mitochondria miscommunication is an early and causal trigger of hepatic insulin resistance and steatosis. J. Hepatol. 2022;77(3):710–722. doi: 10.1016/j.jhep.2022.03.017. [DOI] [PubMed] [Google Scholar]
- 44.Gincel D., Shoshan-Barmatz V. Glutamate interacts with VDAC and modulates opening of the mitochondrial permeability transition pore. J. Bioenerg. Biomembr. 2004 Apr;36(2):179–186. doi: 10.1023/b:jobb.0000023621.72873.9e. [DOI] [PubMed] [Google Scholar]
- 45.Rostovtseva T.K., Komarov A., Bezrukov S.M., Colombini M. VDAC channels differentiate between natural metabolites and synthetic molecules. J. Membr. Biol. 2002 May 15;187(2):147–156. doi: 10.1007/s00232-001-0159-1. [DOI] [PubMed] [Google Scholar]
- 46.Yehezkel G., Hadad N., Zaid H., Sivan S., Shoshan-Barmatz V. Nucleotide-binding sites in the voltage-dependent anion channel: characterization and localization. J. Biol. Chem. 2006 Mar 3;281(9):5938–5946. doi: 10.1074/jbc.M510104200. [DOI] [PubMed] [Google Scholar]
- 47.Shoshan-Barmatz V., Gincel D. The voltage-dependent anion channel characterization, modulation, and role in mitochondrial function in cell life and death. Cell Biochem. Biophys. 2003 Dec;39(3):279–292. doi: 10.1385/CBB:39:3:279. [DOI] [PubMed] [Google Scholar]
- 48.Shoshan-Barmatz V., Shteinfer-Kuzmine A., Verma A. VDAC1 at the intersection of cell metabolism, apoptosis, and diseases. Biomolecules. 2020;10(11):1–40. doi: 10.3390/biom10111485. [DOI] [PMC free article] [PubMed] [Google Scholar]
- 49.Shoshan-Barmatz V., Maldonado E.N., Krelin Y. VDAC1 at the crossroads of cell metabolism, apoptosis and cell stress. Cell Stress. 2017;1:11–36. doi: 10.15698/cst2017.10.104. Shared Science Publishers OG. [DOI] [PMC free article] [PubMed] [Google Scholar]
- 50.Pittala S., Krelin Y., Kuperman Y., Shoshan-Barmatz V. A mitochondrial VDAC1-based peptide greatly suppresses steatosis and NASH-associated pathologies in a mouse model. Mol. Ther. 2019 Oct 2;27(10):1848–1862. doi: 10.1016/j.ymthe.2019.06.017. [DOI] [PMC free article] [PubMed] [Google Scholar]
- 51.Lee K., Kerner J., Hoppel C.L. Mitochondrial carnitine palmitoyltransferase 1a (CPT1a) is part of an outer membrane fatty acid transfer complex. J. Biol. Chem. 2011 Jul 22;286(29):25655–25662. doi: 10.1074/jbc.M111.228692. [DOI] [PMC free article] [PubMed] [Google Scholar]
- 52.Arif T., Vasilkovsky L., Refaely Y., Konson A., Shoshan-Barmatz V. Silencing VDAC1 expression by siRNA inhibits cancer cell proliferation and tumor growth in vivo. Mol. Ther. Nucleic Acids. 2014 Jan 1;3:e159. doi: 10.1038/mtna.2014.9. [DOI] [PMC free article] [PubMed] [Google Scholar]
- 53.Shoshan-Barmatz V., De S., Meir A. The mitochondrial voltage-dependent anion channel 1, Ca2+ transport, apoptosis, and their regulation. Front. Oncol. 2017 Apr 10;7(APR):1. doi: 10.3389/fonc.2017.00060. [DOI] [PMC free article] [PubMed] [Google Scholar]
- 54.Pérez-Gracia E., Torrejón-Escribano B., Ferrer I. Dystrophic neurites of senile plaques in Alzheimer's disease are deficient in cytochrome c oxidase. Acta Neuropathol. 2008;116(3):261–268. doi: 10.1007/s00401-008-0370-6. [DOI] [PubMed] [Google Scholar]
- 55.Cuadrado-Tejedor M., Vilariño M., Cabodevilla F., Del Río J., Frechilla D., Pérez-Mediavilla A. Enhanced expression of the voltage-dependent anion channel 1 (VDAC1) in Alzheimer's disease transgenic mice: an insight into the pathogenic effects of amyloid-β. J Alzheimers Dis. 2011;23(2):195–206. doi: 10.3233/JAD-2010-100966. [DOI] [PubMed] [Google Scholar]
- 56.Manczak M., Reddy P.H. Abnormal interaction of VDAC1 with amyloid beta and phosphorylated tau causes mitochondrial dysfunction in Alzheimer's disease. Hum. Mol. Genet. 2012 Dec;21(23):5131–5146. doi: 10.1093/hmg/dds360. [DOI] [PMC free article] [PubMed] [Google Scholar]
- 57.Ahmed M., Muhammed S.J., Kessler B., Salehi A. Mitochondrial proteome analysis reveals altered expression of voltage dependent anion channels in pancreatic β-cells exposed to high glucose. Islets. 2010 Sep;2(5):283–292. doi: 10.4161/isl.2.5.12639. [DOI] [PubMed] [Google Scholar]
- 58.Gong D., Chen X., Middleditch M., Huang L., Amarsingh G.V., Reddy S., et al. Quantitative proteomic profiling identifies new renal targets of copper(II)-selective chelation in the reversal of diabetic nephropathy in rats. Proteomics. 2009 Sep 1;9(18):4309–4320. doi: 10.1002/pmic.200900285. [DOI] [PubMed] [Google Scholar]
- 59.Kim J., Gupta R., Blanco L.P., Yang S., Shteinfer-Kuzmine A., Wang K., et al. VDAC oligomers form mitochondrial pores to release mtDNA fragments and promote lupus-like disease. Science. 2019 Dec 20;366(6472):1531–1536. doi: 10.1126/science.aav4011. [DOI] [PMC free article] [PubMed] [Google Scholar]
- 60.Branco A.F., Pereira S.L., Moreira A.C., Holy J., Sardão V.A., Oliveira P.J. Isoproterenol cytotoxicity is dependent on the differentiation state of the cardiomyoblast H9c2 cell line. Cardiovasc. Toxicol. 2011;11(3):191–203. doi: 10.1007/s12012-011-9111-5. [DOI] [PubMed] [Google Scholar]
- 61.Rieusset J. Endoplasmic reticulum-mitochondria calcium signaling in hepatic metabolic diseases. Biochim. Biophys. Acta Mol. Cell Res. 2017 Jun;1864(6):865–876. doi: 10.1016/j.bbamcr.2017.01.001. [DOI] [PubMed] [Google Scholar]
- 62.Rieusset J. The role of endoplasmic reticulum-mitochondria contact sites in the control of glucose homeostasis: an update. Cell Death Dis. 2018;9(3):1–12. doi: 10.1038/s41419-018-0416-1. [DOI] [PMC free article] [PubMed] [Google Scholar]
- 63.Liu J., Tang T., Wang G.D., Liu B. LncRNA-H19 promotes hepatic lipogenesis by directly regulating miR-130a/PPARγ axis in non-alcoholic fatty liver disease. Biosci. Rep. 2019 Jul 16;39(7) doi: 10.1042/BSR20181722. [DOI] [PMC free article] [PubMed] [Google Scholar]
- 64.Wang H., Cao Y., Shu L., Zhu Y., Peng Q., Ran L., et al. Long non-coding RNA (lncRNA) H19 induces hepatic steatosis through activating MLXIPL and mTORC1 networks in hepatocytes. J. Cell Mol. Med. 2020 Jan 1;24(2):1399–1412. doi: 10.1111/jcmm.14818. [DOI] [PMC free article] [PubMed] [Google Scholar]
- 65.Bartlett P.J., Gaspers L.D., Pierobon N., Thomas A.P. Calcium-dependent regulation of glucose homeostasis in the liver. Cell Calcium. 2014 Jun 1;55(6):306–316. doi: 10.1016/j.ceca.2014.02.007. [DOI] [PubMed] [Google Scholar]
- 66.Chen Y., Ding H., Wei M., Zha W., Guan S., Liu N., et al. MSC-secreted exosomal H19 promotes trophoblast cell invasion and migration by downregulating let-7b and upregulating FOXO1. Mol. Ther. Nucleic Acids. 2020 Mar 3;19:1237. doi: 10.1016/j.omtn.2019.11.031. [DOI] [PMC free article] [PubMed] [Google Scholar]
- 67.Wu H.Y., Cheng Y., Jin L.Y., Zhou Y., Pang H.Y., Zhu H., et al. Paternal obesity impairs hepatic gluconeogenesis of offspring by altering Igf2/H19 DNA methylation. Mol. Cell. Endocrinol. 2021 Jun 1:529. doi: 10.1016/j.mce.2021.111264. [DOI] [PubMed] [Google Scholar]
- 68.Deng J., Mueller M., Geng T., Shen Y., Liu Y., Hou P., et al. H19 lncRNA alters methylation and expression of Hnf4α in the liver of metformin-exposed fetuses. Cell Death Dis. 2017;8(12) doi: 10.1038/cddis.2017.392. [DOI] [PMC free article] [PubMed] [Google Scholar]
- 69.Zhang N., Geng T., Wang Z., Zhang R., Cao T., Camporez J.P., et al. Elevated hepatic expression of H19 long noncoding RNA contributes to diabetic hyperglycemia. JCI Insight. 2018 May 5;3(10) doi: 10.1172/jci.insight.120304. [DOI] [PMC free article] [PubMed] [Google Scholar]
- 70.Xu X., Ji S., Li W., Yi B., Li H., Zhang H., et al. LncRNA H19 promotes the differentiation of bovine skeletal muscle satellite cells by suppressing Sirt1/FoxO1. Cell. Mol. Biol. Lett. 2017 Jun 23;22(1) doi: 10.1186/s11658-017-0040-6. [DOI] [PMC free article] [PubMed] [Google Scholar]
- 71.Kumar A., Datta M. H19 inhibition increases HDAC6 and regulates IRS1 levels and insulin signaling in the skeletal muscle during diabetes. Mol. Med. 2022 Dec 1;28(1) doi: 10.1186/s10020-022-00507-3. [DOI] [PMC free article] [PubMed] [Google Scholar]
- 72.Gui W., Zhu W.F., Zhu Y., Tang S., Zheng F., Yin X., et al. LncRNAH19 improves insulin resistance in skeletal muscle by regulating heterogeneous nuclear ribonucleoprotein A1. Cell Commun. Signal. 2020 Dec 1;18(1) doi: 10.1186/s12964-020-00654-2. [DOI] [PMC free article] [PubMed] [Google Scholar]
- 73.Sharabi K., Tavares C.D.J., Rines A.K., Puigserver P. Molecular pathophysiology of hepatic glucose production. Mol. Aspect. Med. 2015 Dec;46:21–33. doi: 10.1016/j.mam.2015.09.003. [DOI] [PMC free article] [PubMed] [Google Scholar]
- 74.Ghafouri-Fard S., Abak A., Mohaqiq M., Shoorei H., Taheri M. Interaction between non-coding RNAs and JNK in human disorders. Biomed. Pharmacother. 2021 Jun 1;138 doi: 10.1016/j.biopha.2021.111497. [DOI] [PubMed] [Google Scholar]
- 75.Mu W., Cheng X., Zhang X., Liu Y., Lv Q., Liu G., et al. Hinokiflavone induces apoptosis via activating mitochondrial ROS/JNK/caspase pathway and inhibiting NF‐κB activity in hepatocellular carcinoma. J. Cell Mol. Med. 2020 Jul 9;24(14):8151–8165. doi: 10.1111/jcmm.15474. [DOI] [PMC free article] [PubMed] [Google Scholar]
- 76.Lim J., Lee H., Hojung M., Song J. Coupling mitochondrial dysfunction to endoplasmic reticulum stress response: a molecular mechanism leading to hepatic insulin resistance. Cell. Signal. 2009 Jan;21(1):169–177. doi: 10.1016/j.cellsig.2008.10.004. [DOI] [PubMed] [Google Scholar]
- 77.Lawan A., Bennett A.M. Mitogen-activated protein kinase regulation in hepatic metabolism. Trends Endocrinol. Metabol. 2017 Dec;28(12):868–878. doi: 10.1016/j.tem.2017.10.007. [DOI] [PMC free article] [PubMed] [Google Scholar]
- 78.Kim J., Wei Y., Sowers J.R. Role of mitochondrial dysfunction in insulin resistance. Circ. Res. 2008 Feb 29;102(4):401–414. doi: 10.1161/CIRCRESAHA.107.165472. [DOI] [PMC free article] [PubMed] [Google Scholar]
- 79.Verma A., Shteinfer-Kuzmine A., Kamenetsky N., Pittala S., Paul A., Nahon Crystal E., et al. Targeting the overexpressed mitochondrial protein VDAC1 in a mouse model of Alzheimer's disease protects against mitochondrial dysfunction and mitigates brain pathology. Transl. Neurodegener. 2022 Dec 28;11(1):1–30. doi: 10.1186/s40035-022-00329-7. 2022 111. [DOI] [PMC free article] [PubMed] [Google Scholar]
- 80.Ben-Hail D., Begas-Shvartz R., Shalev M., Shteinfer-Kuzmine A., Gruzman A., Reina S., et al. Novel compounds targeting the mitochondrial protein VDAC1 inhibit apoptosis and protect against mitochondrial dysfunction. J. Biol. Chem. 2016 Nov 25;291(48):24986–25003. doi: 10.1074/jbc.M116.744284. [DOI] [PMC free article] [PubMed] [Google Scholar]
- 81.Pittala S., Levy I., De S., Kumar Pandey S., Melnikov N., Hyman T., et al. The VDAC1-based R-tf-D-LP4 peptide as a potential treatment for diabetes mellitus. Cells. 2020 Feb 19;9(2):481. doi: 10.3390/cells9020481. 2020, Vol 9, Page 481. [DOI] [PMC free article] [PubMed] [Google Scholar]
Associated Data
This section collects any data citations, data availability statements, or supplementary materials included in this article.
Data Availability Statement
Data will be made available on request.