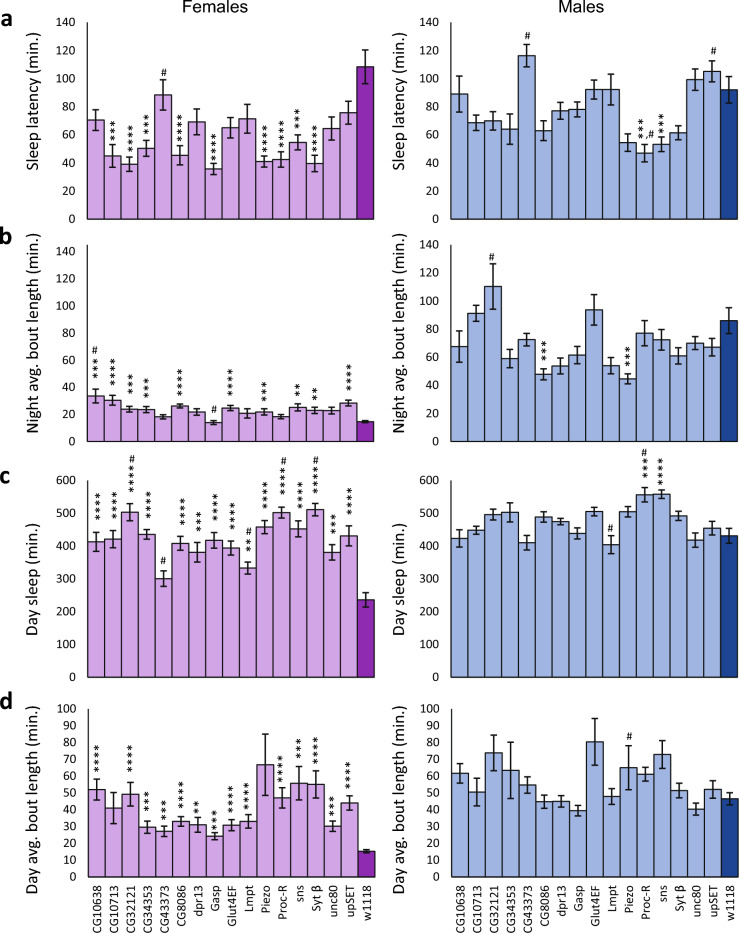
Figure 4.
Minos insertions having a w1118 control affect sleep latency and exhibit pleiotropic effects on some sleep phenotypes. The plots show mean sleep phenotypes ± SEM in Minos insertion lines contrasted with the sleep phenotypes of the w1118 isogenic control. Light purple bars indicate female data, with the w1118 control shown in dark purple. Light blue bars indicate male data, with the w1118 control shown in dark blue. (a) Sleep latency. (b) Night avg. bout length. (c) Day sleep duration. (d) Day avg. bout length. Asterisks show the level of significance: **** P ≤ 0.0001; *** 0.0001 < P ≤ 0.001; ** 0.001 < P ≤ 0.0031. A pound sign (#) shows those mutants that are also significantly different from the overall mean of all mutant data combined.

