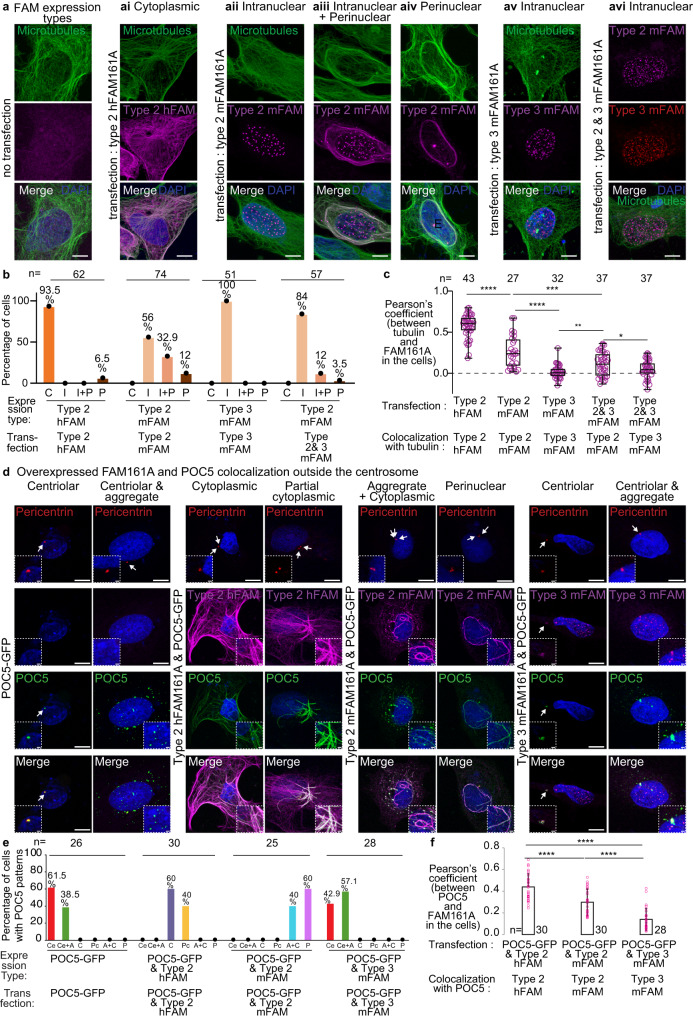
Fig. 4. Human and house mouse FAM161A isoforms have different microtubule and POC5 interactions.
a Expression analysis of human FAM161A (hFAM161A) type 2 (second panel from left), house mouse FAM161A (mFAM161A) type 2 (middle three panels), mFAM161A type 3 (second panel from right), and the combination of mFAM161A types 2 and 3 (right panel) in U2OS cells. b Quantification showing the percentage of cells exhibiting each of the various expression patterns observed during expression analysis of hFAM161A type 2, mFAM161A type 2, mFAM161A type 3, and the combination of mFAM161A types 2 and 3. C, “Cytoplasmic”; I, “Intranuclear”; I + P, “Mix intranuclear-perinuclear”; P, “Perinuclear”. c Quantification of FAM161A colocalization with tubulin. ****P < 0.0001, ***P < 0.001, **P < 0.01, *P < 0.05 (unpaired, two-tailed t test; exact p-values are provided in the Source Data File); ns not significant, n number of cells, scale bars are 8 µm. The data shown are the representative images and compiled quantification from three independent experiments. Data are presented as box and whisker plots, where upper and lower bounds show interquartile range, the line within the box shows the median, and whiskers show minimum and maximum data points. d Co-overexpression of FAM161A isoforms and POC5 in U2OS cells. The inset in the bottom left corner shows a zoomed view of the site of the centriole, and the inset in the bottom right corner shows a zoomed view of non-centriolar POC5 locations in the cell. Scale bars are 8 µm, inset scale bar is 1 µm. e Quantification showing the percentage of cells exhibiting the various expression patterns observed during expression analysis of hFAM161A type 2, mFAM161A type 2, and mFAM161A type 3. Ce, “Centriolar”; Ce+A, “Centriolar + Aggregate”; C, “Cytoplasmic”; Pc, “Partial Cytoplasmic”; A + C, “Aggregate + Cytoplasmic”; P, “Perinuclear”. f Quantification of FAM161A colocalization with POC5. Statistical analysis used was unpaired, two-tailed t test. Source data are provided in the Source Data File.

