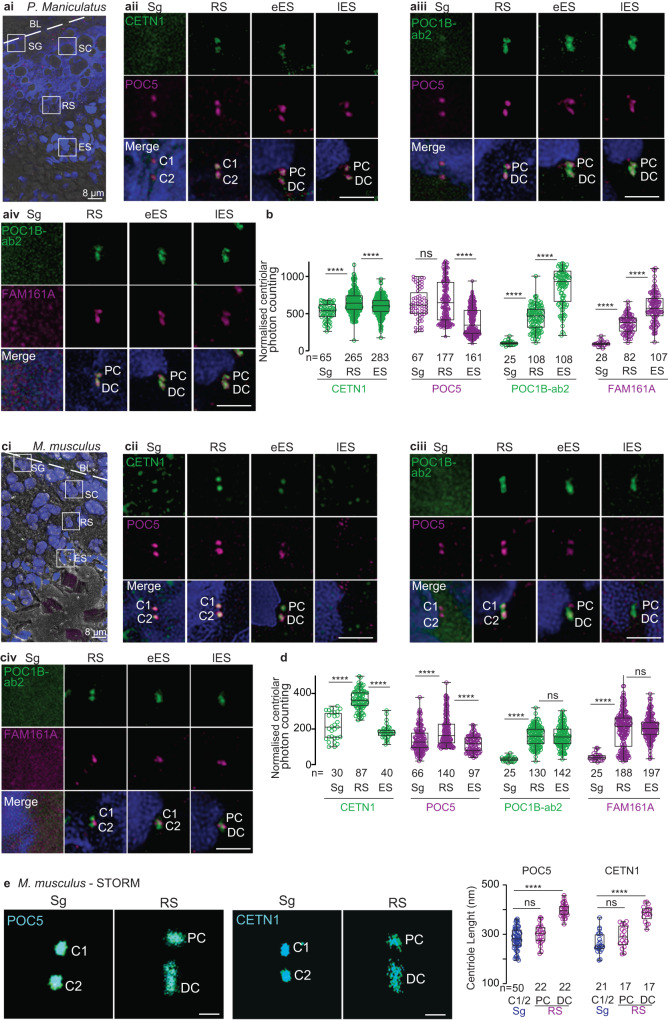
Fig. 7. Unlike the deer mouse remodeling program, the house mouse centriole degradation program begins in elongated spermatids.
a, c A single seminiferous tubule section showing various stages of spermatogenesis in deer mice (ai) and house mice (ci). The white dotted line indicates the basal lamina boundary. BL basal lamina, Sg spermatogonia, Sc spermatocyte, RS round spermatid, Es elongated spermatid, Lu lumen. Scale bars are 8 μm. Representative images of various rod proteins at various stages of spermatogenesis in deer mice (aii–iv) and house mice (cii–iv). b, d Quantification of the combined proximal and distal centriolar localization of various proteins at various stages of sperm development in deer mice (b) and house mice (d). e STORM imaging of house mouse testes with POC5 and CETN1 staining in spermatogonia/spermatocytes (Sg) and round spermatids (RS) (left panels). Measurements of centriolar length as determined using STORM imaging (right panel). Scale bars are 0.4 μm. The data were generated from three independent experiments; n number of cells in b and d, and number of centrioles in e. The graphs are presented as box and whisker plots, where upper and lower bounds show interquartile range, the line within the box shows the median, and the whiskers show minimum and maximum data points. ****P < 0.0001, ***P < 0.001, **P < 0.01, *P < 0.05 (unpaired, two-tailed t-test; exact p-values are provided in the Source Data File). Source data are provided in the Source Data File.

