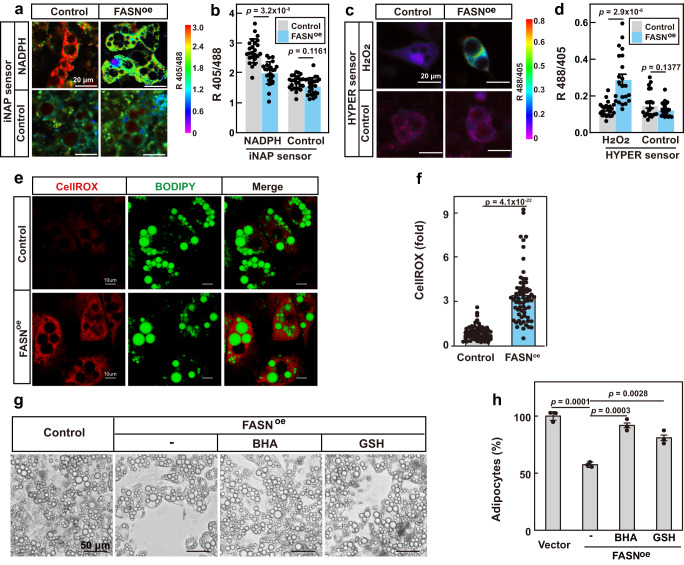
Fig. 2. Increased ROS production drives necroptosis of FASN-overexpressing adipocytes.
iNAP sensors for NADPH (a, b) or HYPER sensors for H2O2 (c, d) were introduced to control or FASNoe 3T3-L1 cells by lentivirus. Cells were differentiated. On day 12, cells were imaged and data were processed as in Methods. e, f On day 12 of differentiation, control or FASNoe 3T3-L1 adipocytes were treated with CellROX (2.5 μM) for 30 min and harvested for imaging as in Methods. g, h Starting from day 9 of differentiation, control and FASNoe adipocytes were treated with BHA (50 μM) or GSH (1 mM). On day 15, cells were harvested for imaging under bright field (g) and quantification of the cell numbers (h). For b, d, each value represents mean ± s.e.m. from 20 cells. For f, each value represents mean ± s.e.m. from 70 cells. For h, each value represents mean ± s.e.m. from 3 samples. Scale bars are as indicated. Statistical analysis was performed using two-sided unpaired Student’s t-tests.

