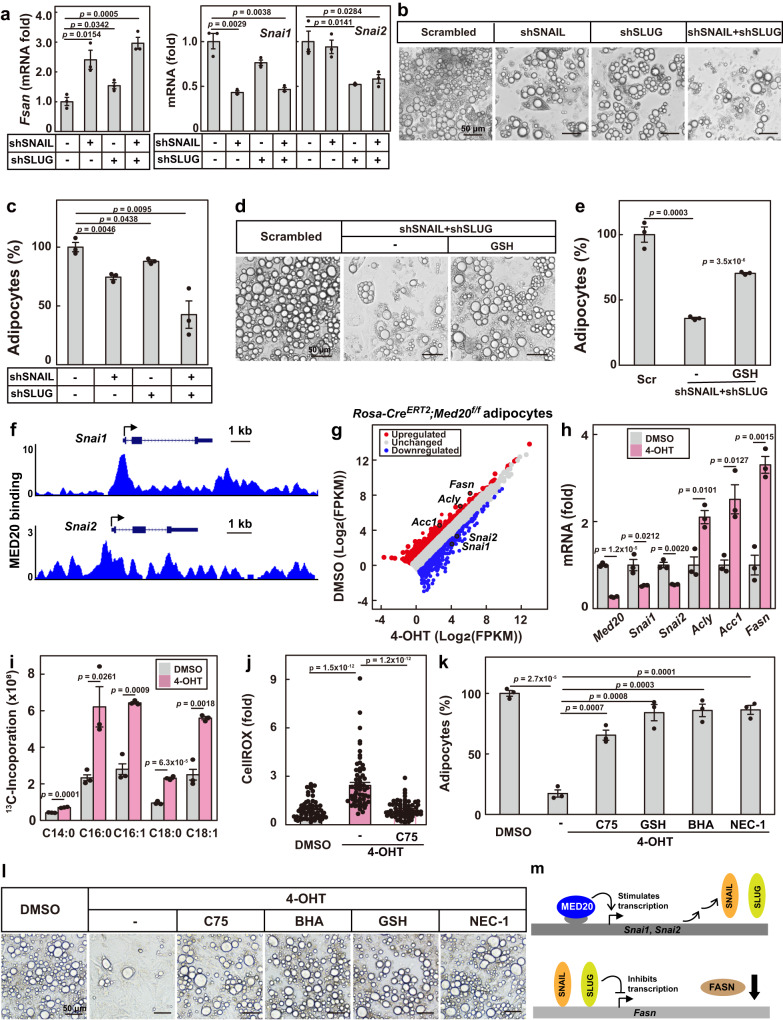
Fig. 3. MED20 inhibits the transcription of Fasn through SNAIL and SLUG.
a–c On day 4 of differentiation, 3T3-L1 cells were infected with lentivirus encoding the indicated shRNAs. a On day 9 of differentiation, cells were harvested for qRT-PCR analysis of the indicated genes. On day 14, cells were harvested for imaging under bright field (b) and quantification of cell numbers (c). d, e On day 9 of differentiation, control or SNAIL and SLUG double knockdown adipocytes were treated with GSH (1 mM) for 3 days. On day 14, cells were harvested for imaging under bright field (d) and quantification of cell numbers (e). f ChIP-Seq analysis of the binding of MED20 on the promoters of Snai1 and Snai2 in control and MED20 knockdown 3T3-L1 cells. The data were reanalyzed from GEO: GSE163281. g–l Primary SVFs were isolated from Rosa-CreERT2;Med20f/f mice, differentiated into mature adipocytes, and induced with 4-OHT to delete Med20 on day 6. On day 9, cells were harvested and RNA was extracted for RNA-Seq (g) and qRT-PCR (h) analysis. i on day 9, de novo fatty acid synthesis was performed as in Fig. 1f. j On day 12, cells were treated with CellROX (2.5 μM) for 30 min and harvested for imaging as in Fig. 2e. k, l On day 9, cells were treated with C75 (50 μM), BHA (50 μM), GSH (1 mM) or NEC-1 (20 μM) for 3 days. On day 14, cells were harvested for quantification of cell numbers (k) and imaging under bright field (l). For a,c,e,h,I and k, each value represents mean ± s.e.m. from 3 samples. For j, Each value represents mean ± s.e.m. from 70 samples. m A summary of the findings in this figure. Scale bars are as indicated. Statistical analysis was performed using two-sided unpaired Student’s t-tests.

