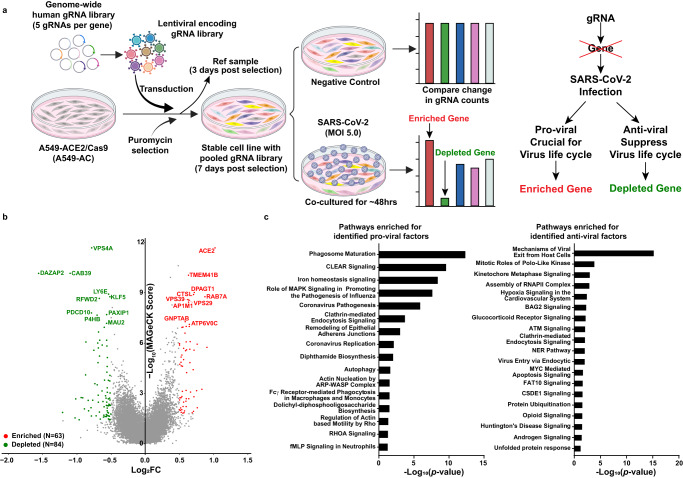
Fig. 1. Discovery of host factors controlling SARS-CoV-2 infection.
a A schematic diagram of the functional CRISPR/Cas9 dropout screen based on virus-induced cytopathic effect (CPE). A549-AC cells were transduced with a genome-wide human gRNA library (five gRNAs per gene) and followed by puromycin selection. After 3-day puromycin selection, 30 million pooled cells were collected as the reference sample. On day 7 after selection, pooled A549-AC cells were infected with recombinant SARS-CoV-2 at MOI = 5 for 48 h. Pooled A549-AC cells without viral treatment were severed as the controls. The changes in gRNA distribution between the virus-infected samples and controls were determined. b A volcano plot showing top candidates for pro-viral and anti-viral host factors. The gene-level MAGeCK scores and the changes in gRNA distribution between A549-AC cells with and without viral infection were calculated. The log2 fold change of the second-best gRNA for each gene was selected for data representation. Genes whose gRNAs were significantly enriched or depleted in the infected group (P value < 0.05 and |log2FC | ≥0.5) were labeled as red and green dots, respectively. The top ten enriched/depleted (pro-viral/anti-viral) genes based on MAGeCK scores were indicated. P values were calculated from the negative-binomial model. Two one-sided P values were provided to test whether gRNA was positively or negatively selected. Adjusted P value was calculated by using the Benjamini–Hochberg procedure. c Ingenuity Pathway Analysis of identified host factors for SARS-CoV-2 infection. Enriched pathways for pro-viral factors (enriched, left panel) and anti-viral factors (depleted, right panel) with statistical significance (P value < 0.05) were illustrated. P values for each gene set were calculated by using a Right-Tailed Fisher’s Exact Test and exact P values were provided in the source data file.

