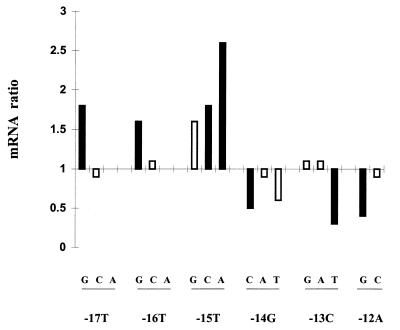
FIG. 3.
The effect on mRNA levels of single substitutions at each position in the M12 consensus promoter. Changes that increase transcription are shown above the axis, and those that decrease transcription are shown below the axis; the height of each bar represents the ratio of RNA to that of M12. The solid bars represent statistically significant differences from M12, as indicated in Table 1. The nucleotide change associated with each mutant promoter is indicated below each bar.

