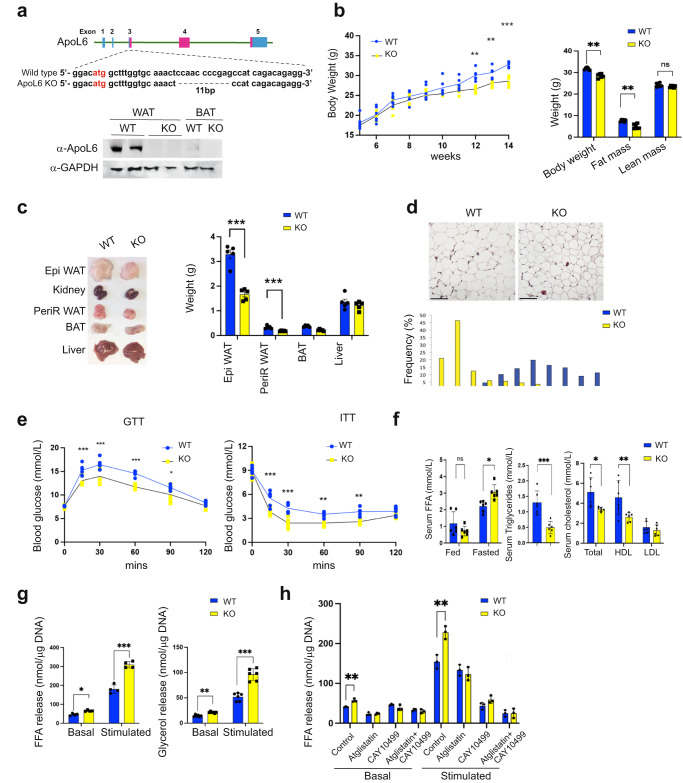
Fig. 3. ApoL6 ablation in mice results in lean phenotype with increased WAT lipolysis.
a 11 bp deletion in exon 3 of ApoL6 gene and ApoL6 protein level in WAT and BAT of WT and ApoL6 KO mice. b BW during HFD feeding (n = 6, **p = 0.0018 and 0.0072, ***p < 0.001, two-way AVOVA test) and EchoMRI after HFD (n = 6, ***p < 0.001, multiple t test). c Tissue pictures and tissue weights after 10 wks of HFD feeding (n = 5, ***p < 0.001). d H&E staining (bar = 100 μm) and quantification of cell sizes of WAT. e GTT and ITT after HFD (n = 6, GTT: ***p < 0.001, *p = 0.0347; ITT: **p = 0.0056 and 0.0013, ***p < 0.001, two-way ANOVA test). f Serum FFA in fed and fasted conditions (n = 6, *p = 0.011, multiple t test), TAG (n = 6, ***p < 0.001) and cholesterol levels in the fed condition (n = 6, *p = 0.0167, **p = 0.0058). Data represent mean ± SD. g FFA (n = 4, *p = 0.017, ***p < 0.001) and glycerol release (n = 6, **p = 0.005, ***p < 0.001) from dispersed adipocytes isolated from WAT. h FFA release from cultured primary adipocytes treated with inhibitors (n = 3, **p = 0.0028 and 0.0058). Data represent mean ± SD. Experiments were repeated twice.

