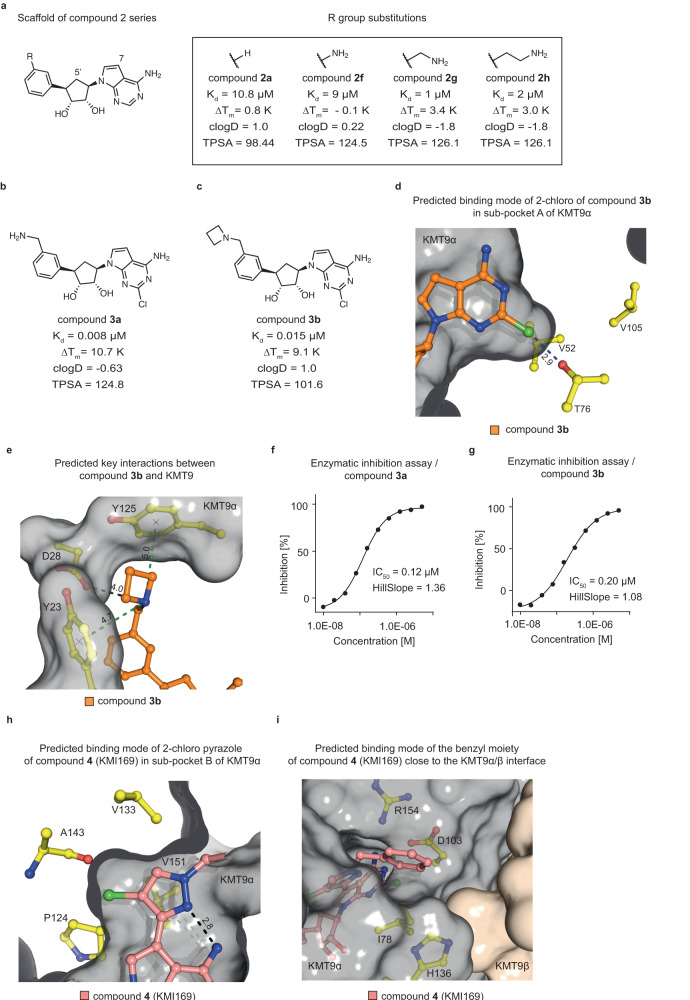
Fig. 2. Structure-guided lead optimization of KMT9 inhibitors.
a Chemical structures of the compound 2 series. The scaffold structure (left) and the R group substitutions (right) for compounds 2a and 2f-h are represented. Measured Kd and ΔTm values and calculated clogD and TPSA values for each compound are listed. b, c Chemical structures of compounds 3a and 3b. Measured Kd and ΔTm values and estimated clogD and TPSA values are listed. d, e Predicted binding of the 2-chloro substituent of compound 3b (orange) into sub-pocket A of KMT9α (d) and key interactions between compound 3b and KMT9α residues (yellow) (e). ΚΜΤ9α is shown as grey surface. Key residues and ligand are shown as sticks. Contacts are represented by blue (halogen bond) (d) green (cation-π interactions); (e) or black dashed lines (charged interaction) (e). f, g Enzymatic inhibition of KMT9 by compounds 3a (f) and 3b (g). Data represent means (n = 2 independent experiments). h, i Representations of the predicted binding modes of the 2-chloro-pyrazole moiety of compound 4 (KMI169) (pink) in sub-pocket B of KMT9α (h) and of the benzyl substituent of compound 4 (KMI169) at the KMT9α/β interface (i). ΚΜΤ9α (grey) and KMT9β (brown) are shown as surface view. KMT9α key residues (yellow) and ligands are shown as sticks. The intra-molecular hydrogen bond in the 2-chloro-pyrazole moiety (h) is represented by a black dashed line.

