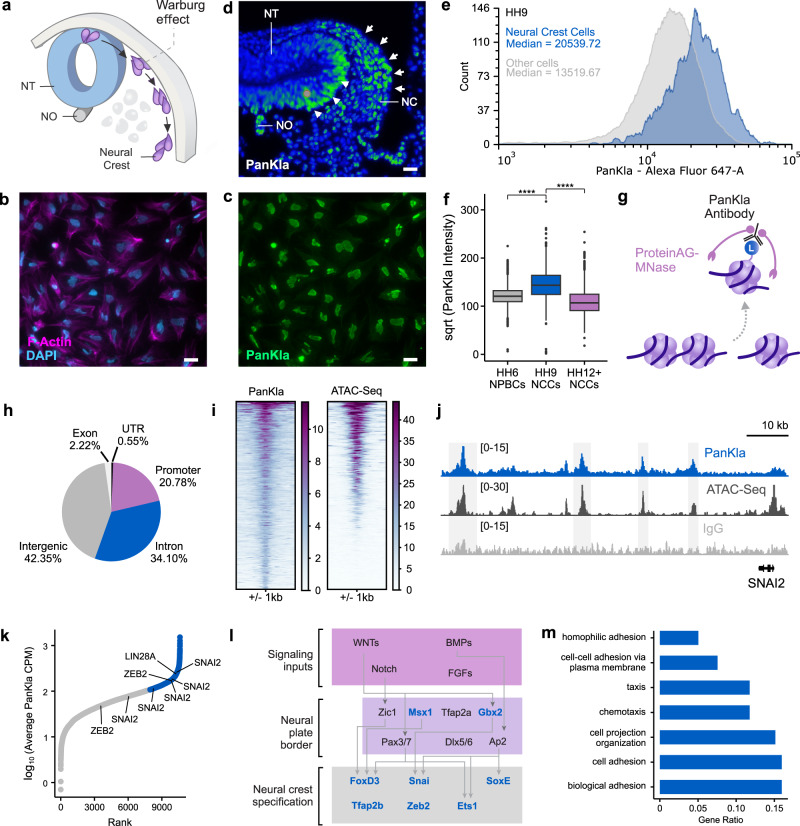
Fig. 1. Lactylation exhibits spatiotemporal specificity in NCCs.
a Diagram depicting a cross-section of a chick embryo head with NCC migration path. Increased aerobic glycolysis prior to delamination of NCCs from the neural tube (NT) promotes EMT and migration. The neural tube (NT) and notochord (NO) are also labeled. Reprinted from Bhattacharya et al.4, with permission from Elsevier. b, c IF staining for PanKla of migratory NCCs from explant cultures showing enrichment of lactylation in the nuclei (n = 4/4 biological replicates with similar results). Scale bars represent 20 µm. d Pseudocolor image of PanKla fluorescence intensity from IF staining on transverse section from HH12 embryonic head displaying the enrichment of lactylation in NCCs (white arrows) and cells in the NT (white arrowheads) (n = 2/2 biological replicates with similar results). Scale bar represents 20 µm. e Histogram of PanKla fluorescence intensity from the flow cytometric analysis of HH9 embryonic heads. Distribution of lactylation levels in TFAP2B+ NCCs (blue, n = 1546) are overlayed on the distribution of lactylation levels in other (TFAP2B-) embryonic head cells (gray, n = 15,559). The median for each distribution is shown. f Boxplots of square-root-transformed PanKla fluorescence intensity (Alexa647-A) in PAX7+ NPBCs (n = 2591) from HH6 embryos and AP2B+ NCCs from HH9 (n = 1537) and HH12–13 (n = 2471) embryos. ****p value < 2 × 10⁻¹⁶, Kruskal–Wallis test (χ2 = 2619.7, degrees of freedom (df) = 2), followed by ad hoc pair-wise Wilcoxon rank sum test. The p value was corrected for multiple comparisons using FDR approach. Boxplot center line is median, box limits are upper and lower quartiles, whiskers are the 1.5X interquartile range, and individual points are outliers. g Schematic depicting CUT&RUN working principle involving antibody-targeted digestion of chromatin by ProteinAG-MNase fusion protein. h Pie chart showing the genomic distribution of PanKla peaks in HH9 NCCs. i Tornado plots showing PanKla and ATAC-seq signal at consensus PanKla peakset. j Genome browser tracks showing PanKla CUT&RUN and ATAC-seq peaks at the SNAI2 locus. IgG track included as a control. k Scatter plot of consensus PanKla peaks ranked by their average sequencing-depth normalized signal between replicate CUT&RUNs (n = 10,612 peaks). Peaks associated with important NCC genes are labeled with the genes they correspond to. Peak with the highest levels of lactylation, upon binning the data, are labeled in blue. l Schematic of initial modules of the NCC GRN with genes containing lactylation peaks highlighted in blue. m Bar plot displaying a subset of significant (FDR < 0.05) results from the gene ontology enrichment analysis of genes associated with the top third PanKla peaks with highest average signal. Results obtained by using the enrichGO() function of the R package clusterProfiler to run a gene ontology over-representation test. RefSeq gene annotation tracks are used to visualize genes in genome browser panels. Non-curated non-coding RNA annotations are not displayed.

