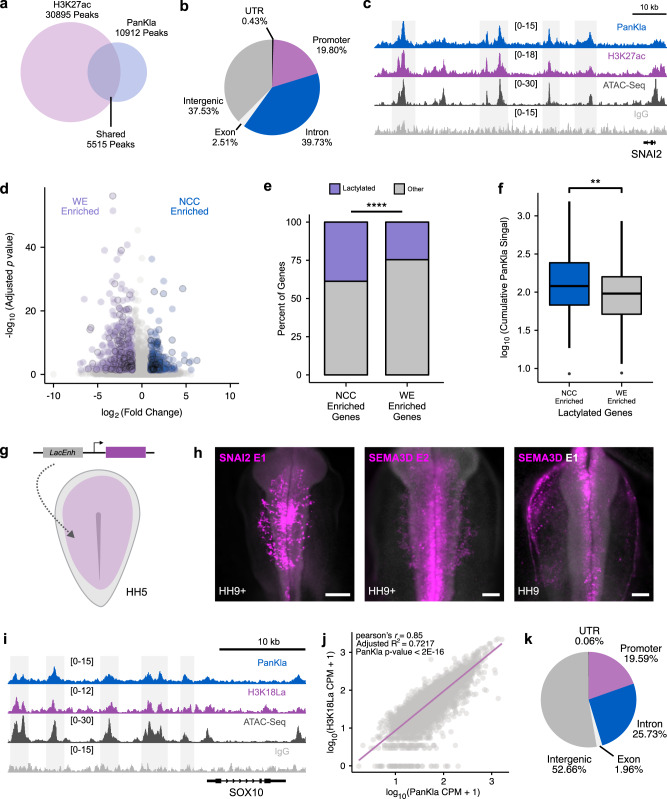
Fig. 2. Lactylation marks active tissue-specific enhancers.
a Venn diagram showing the overlap between consensus H3K27ac and PanKla peaksets from HH9 NCCs. b Pie chart showing the genomic distribution of lactylation peaks that overlap with H3K27ac peaks. c Genome browser tracks showing PanKla CUT&RUN, H3K27ac CUT&RUN, and ATAC-seq peaks at the SNAI2 locus. IgG track included as a control. d Volcano plot of genes from LRT comparing NCCs to WE cells across six developmental stages. Genes that are significantly enriched in NCCs are labeled in blue whereas genes that are significantly enriched in WE are labeled in purple (FDR < 0.05, log2FoldChange cutoff set to 1 in both directions). Genes associated with lactylation peaks are outlined in black. e Mosaic plot showing the percentage of lactylated genes in the NCC and WE gene sets. Lactylated genes are enriched in the NCC gene set (n = 279 total genes) compared to the WE gene set (n = 523 total genes). ****p value < 0.0001 (p value = 4.689 × 10⁻⁵), a chi-squared test was used to test for the association of lactylation status and gene set (χ2 = 16.57, df = 1). f Boxplots of the cumulative sequencing-depth normalized PanKla signal of each lactylated gene in the NCC (n = 108) and WE (n = 129) gene sets. NCC-enriched genes have higher lactylation levels compared to WE-enriched genes. **p value < 0.01 (p value = 0.005882), two-tailed two-sample homoscedastic t-test (t = 2.7797, df = 235, 95% CI [0.0423, 0.248]). Boxplot center line is median, box limits are upper and lower quartiles, whiskers are the 1.5X interquartile range, and individual points are outliers. g Diagram depicting injection of enhancer reporter construct containing putative lactylated enhancer (LacEnh) cloned upstream of a minimal promoter into HH4 chicken embryo. h Embryos expressing GFP reporter driven by sequences underlying lactylation peaks in the SNAI2 (n = 3/3 biological replicates with similar results) and SEMA3D genomic loci (n = 2/2 biological replicates for each SEMA3D enhancer show similar results). SNAI2E1 scale bar represents 200 µm and SEMA3DE2/ SEMA3DE1 scale bar represents 100 µm. i Genome browser tracks showing PanKla CUT&RUN, H3K18La CUT&RUN, and ATAC-seq peaks at the SOX10 locus. IgG track included as a control. j Genome-wide correlation of H3K18La and PanKla average sequencing-depth normalized signal at PanKla consensus peakset (n = 10,912). Linear regression was used to model the relationship between the two variables. k Pie chart showing the genomic distribution of H3K18La peaks. RefSeq gene annotation tracks are used to visualize genes in genome browser panels. Non-curated non-coding RNA annotations are not displayed.

