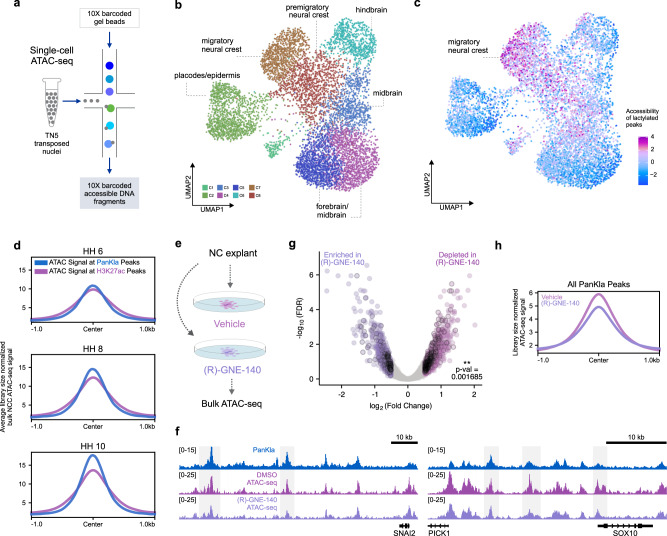
Fig. 3. Lactylation promotes accessibility of genomic regions in NCCs.
a Schematic depicting scATAC-seq workflow. b UMAP projection of scATAC-seq profiles of cells from the dorsal midline of HH9 embryos. Dots represent individual cells while colors indicate cluster identity (labeled). c UMAP projection colored by the degree of accessibility of lactylation-enriched peaks (relative to H3K27ac) from the PanKla CUT&RUN. Lactylated genomic loci are specifically accessible in NCC clusters (C7 and C8). d Profile plots showing the average (between two biological replicates) cumulative ATAC-seq signal at consensus peaks from the PanKla (blue) and H3K27ac (magenta) CUT&RUNs. ATAC-seq data are from samples that consist of sorted NCCs at three developmental stages (HH6, HH8, and HH10). The accessibility of lactylated genomic loci increases as NCCs begin to migrate. e Schematic depicting treatment of NCC explants from HH9 embryos in defined culture conditions with DMSO or 40 uM (R)-GNE-140. ATAC-seq was performed on explants 12 h after treatment to assess the effects of (R)-GNE-140 treatment on chromatin accessibility. f Genome browser tracks showing PanKla CUT&RUN, DMSO and (R)-GNE-140 ATAC-seq peaks at the SNAI2 and SOX10 loci. g Volcano plot showing differentially accessible control peaks between DMSO and (R)-GNE-140 treatments. Differential accessibility analysis was performed using the DBA_EDGER method within the R package DiffBind. Peaks that are significantly depleted in (R)-GNE-140 are labeled in magenta, whereas peaks that are significantly enriched in (R)-GNE-140 are labeled in purple (log2Fold Change cutoff set to 0.5 in both directions). Lactylated peaks are outlined in black. A chi-squared test was used to test for the association of lactylation status and enrichment/depletion in (R)-GNE-140 (χ2 = 9.8649, df = 1, p value = 0.001685). Of the 1699 ATAC-seq peaks that were depleted in (R)-GNE-140, 269 were lactylated whereas only 138 peaks were lactylated among the 1187 peaks that were enriched in (R)-GNE-140. h Profile plots showing the average cumulative ATAC-seq signal of DMSO (magenta) and (R)-GNE-140 (purple) samples at consensus peaks from the PanKla CUT&RUN. RefSeq gene annotation tracks are used to visualize genes in genome browser panels. Non-curated non-coding RNA annotations are not displayed.

