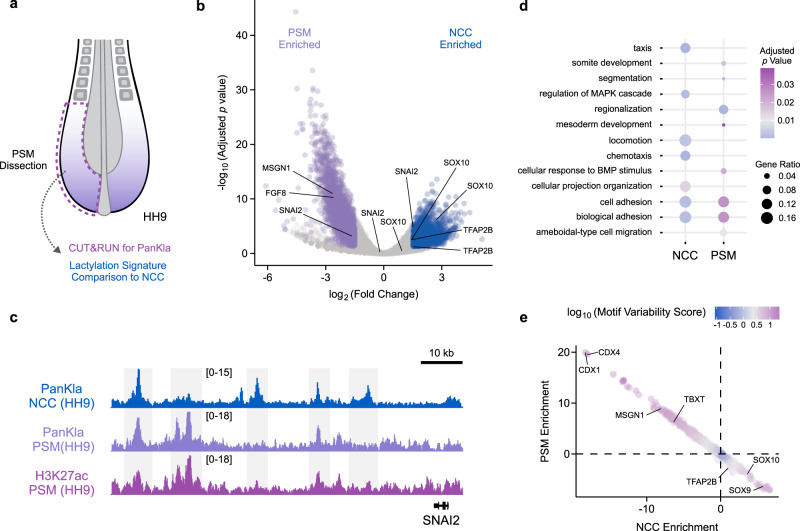
Fig. 4. Deposition of lactylation is cell-type specific.
a Diagram depicting dissection of posterior embryonic tissue containing PSM cells. CUT&RUN for PanKla was performed on PSM tissue and the lactylation signature was compared to that of NCCs. b Volcano plot of differential lactylation peaks between NC and PSM cells. Genes associated with lactylation peaks are labeled on the plot. Significant (FDR < 0.05) lactylation peaks enriched in NCCs are labeled in blue whereas lactylation peaks enriched in PSM cells are labeled in purple (log2Fold Change cutoff set to 1.5 in both directions, DiffBind concentration score >3). Differential accessibility analysis was performed using the DBA_EDGER method within the R package DiffBind. c Genome browser tracks showing NCC and PSM PanKla CUT&RUNs as well as PSM H3K27ac CUT&RUN (Supplementary Fig. 5D–F) at the SNAI2 locus. d Dot plot displaying a subset of significant (FDR < 0.05) results from the gene ontology enrichment analysis of genes associated with NCC or PSM enriched peaks. Results obtained by using the enrichGO() function of the R package clusterProfiler to run a gene ontology over-representation test. e Scatterplot of chromVAR results showing the differential enrichment of transcription factor binding motifs in NC and PSM cells. Axes represent the average deviation z-score of lactylation peaks containing specific motifs in both NCC and PSM samples. Color indicates the variability score of a specific motif in the differential analysis peakset. RefSeq gene annotation tracks are used to visualize genes in genome browser panels. Non-curated non-coding RNA annotations are not displayed.

