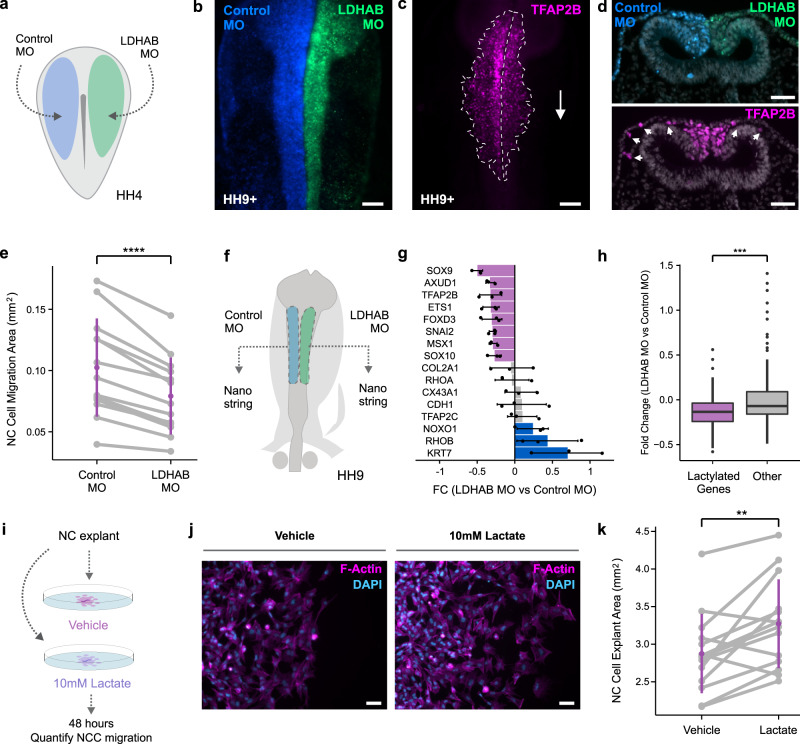
Fig. 5. Reducing lactylation through LDHA/B loss-of-function impedes NCC migration.
a Diagram depicting the bilateral injection of control and LDHA/B MOs in HH4 embryos. b Representative image of HH9+ embryo transfected with Control and LDHA/B MOs. Scale bar represents 100 µm. c IF staining for TFAP2B in embryo from (b) showing reduced NCC migration on the LDHA/B-transfected side. Scale bar represents 100 µm. d Transverse section of HH9+ embryo transfected with Control and LDHA/B MOs. IF staining for TFAP2B shows reduced NCC migration on the LDHA/B-transfected side compared to Control MO side. Scale bar represents 50 µm. e Paired stripchart showing the quantification of NCC migration area from whole mount TFAP2B-stained HH9-HH10 embryos (n = 14 biological replicates). Purple bars represent standard deviation. ****p value < 0.0001 (p value = 1.004 × 10⁻⁵), two-tailed paired homoscedastic t-test (t = 7.2574, df = 12, 95% CI [0.0163, 0.0303]). f Diagram of HH9 embryo depicting experimental strategy for Nanostring experiment. Control and LDHA/B MO transfected neural folds were collected from the same embryo. Nanostring was performed on single paired neural folds. g Bar plot showing fold change (FC) of mRNA levels in LDHA/B MO vs. Control MO samples for important genes in the NCC GRN. Error bars are standard deviation of three biological replicates (n = 3). h Boxplots showing the fold change (LDHA/B vs. Control MO) of lactylated (n = 76) and non-lactylated, or “other” (n = 123) genes in the Nanostring probeset. Lactylated genes are, on average, down-regulated more than other genes in LDHA/B MO neural folds. ***p value < 0.001 (p value = 0.0001383), two-tailed independent heteroscedastic t-test (t = −3.8885, df = 194.76, 95% CI [−0.2255, −0.0737]). Boxplot center line is median, box limits are upper and lower quartiles, whiskers are the 1.5X interquartile range, and individual points are outliers. i Diagram depicting experimental strategy for assessing the effects of lactate treatment on NCC migration. Neural fold explants for control and lactate treatment were collected in a paired fashion from the same embryo. j Staining of NCC explants treated with vehicle (1X PBS) or 10 mM sodium lactate with Phalloidin and DAPI. Scale bar represents 50 µm. k Paired stripchart showing the quantification of NCC explant area (n = 14 biological replicates). Purple bars represent standard deviation. **p value < 0.01 (p value = 0.005), two-tailed paired homoscedastic t-test (t = 3.4, df = 13, 95% CI [0.1417, 0.6526]). Graphics in (a) and (f) were reprinted from Bhattacharya et al.4, with permission from Elsevier.

