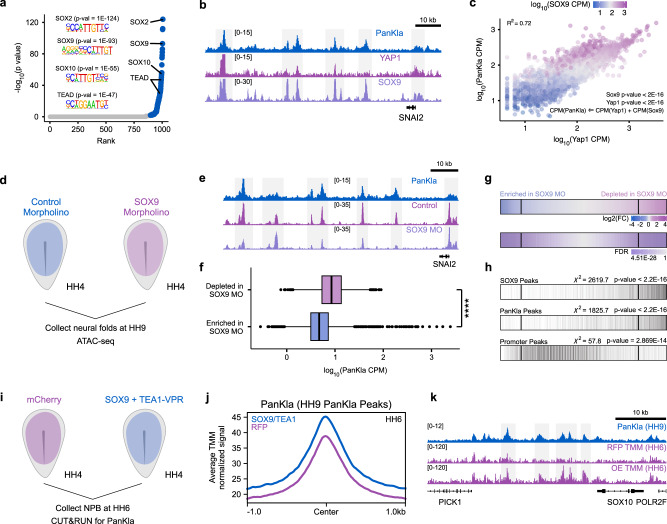
Fig. 6. SOX9 and YAP/TEAD contribute to the deposition of lactylation at NCC-specific loci.
a Scatter plot of transcription factor binding motifs enriched among PanKla peaks ranked by p value. Motifs with an adjusted q-value (Benjamini) less than 0.05 are labeled in blue. A significant enrichment of SOX and TEAD motifs was observed. HOMER was used to perform enriched motif discovery using exact peak sizes. b Genome browser tracks showing PanKla, YAP1, and SOX9 CUT&RUNs at the SNAI2 locus. c Scatter plot of sequencing depth normalized YAP1 and PanKla signal at PanKla peaks. Color indicates the level of SOX9 signal. The relationship between YAP1, SOX9, PanKla was modeled using multiple linear regression with YAP1 and SOX9 occupancy as explanatory variables and PanKla as a response variable (n = 10,448). d Diagram depicting experimental strategy for Control and SOX9 MO injections in HH4 embryos. Neural folds for each condition were then collected at HH9 and subjected to the ATAC-seq workflow. e Genome browser tracks showing PanKla CUT&RUN, Control MO and SOX9 MO ATAC-seq peaks at the SNAI2 locus. f Boxplots of sequencing depth normalized lactylation signal at ATAC-seq peaks that were significantly (FDR < 0.05) enriched (n = 10,775) or depleted (n = 7270) in the SOX9 MO condition compared to Control MO (log2FC cutoff set to 0.5 in both directions, n = 2 biological replicates). ATAC-seq peaks that are depleted in SOX9 MO transfected NCCs have significantly higher lactylation levels. ****p value < 2 × 10⁻¹⁶, two-tailed Wilcoxon rank sum test (W = 57767759). Boxplot center line is median, box limits are upper and lower quartiles, whiskers are the 1.5X interquartile range, and individual points are outliers. g Row heatmaps showing differentially accessible peaks between Control and SOX9 MO treatments. Each line in the heatmap is a peak. Peaks were initially ranked by log2Fold Change (log2FC) (Control vs. SOX9 MO) and vertical lines were drawn at a log2FC threshold of 0.5 in both directions. Differential accessibility analysis was performed using the DBA_EDGER method within the R package DiffBind. h Plot showing the overlap of peaks from (g) with SOX9 and PanKla CUT&RUN peaks as well as ATAC-seq peaks at promoter regions. Vertical black lines indicate overlap. SOX9 and PanKla peaks are enriched among the significant (FDR < 0.05) peaks that are depleted in the SOX9 MO transfected NCCs whereas promoter peaks don’t show a strong enrichment in the same direction. A chi-squared test was used to test for the association of lactylation or SOX9 peak status and whether that peak is enriched or depleted in the SOX9 MO condition (SOX9 χ2 = 2619.7, df = 1; PanKla χ2 = 1825.7, df = 1; Promoter χ2 = 57.8, df = 1). i Diagram depicting experimental strategy for gain-of-function experiment involving the injection of HH4 embryos with either an pCI-H2B-RFP construct or a mixture of SOX9 and TEA1-VPR constructs. Embryos were collected at HH6, dissected to enrich for NPBCs and subjected to CUT&RUN for PanKla. j Profile plot showing the average cumulative TMM normalized HH6 PanKla CUT&RUN signal of RFP (magenta) and SOX9 + TEA1-VPR (purple) samples at HH9 PanKla CUT&RUN consensus peakset. k Genome browser tracks showing replicate average TMM normalized PanKla signal (HH6) for RFP and over-expression (OE) samples at the SOX10 genomic locus. PanKla CUT&RUN tracks from HH9 samples is also shown. RefSeq gene annotation tracks are used to visualize genes in genome browser panels. Non-curated non-coding RNA annotations are not displayed.

