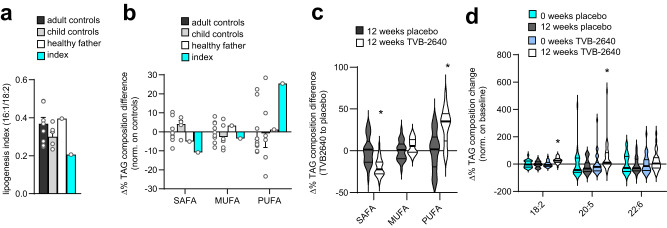
Fig. 2. Lipidomics of genetic and pharmacological FASN modulation.
a Plot of the DNL index, a marker to estimate the rate of DNL which is given as the ratio of (endogenously producible) palmitoleate (16:1) to strictly dietary linoleic acid (18:2) in plasma TAG in the index patient (index), his healthy father, a non-carrier, (healthy father) and adult (adult controls) and child controls (child controls) (data are presented as mean ± SEM for adult control (n = 9) and child controls (n = 6). b Differences in plasma TAG composition per each fatty acid class of the index patient (index) and different controls (adult controls, child controls, healthy father) (data are presented as mean ± SEM for adult control (n = 9) and child controls (n = 6). c Differences in plasma TAG composition per fatty acid class in NASH patients treated with 50 mg of the FASN inhibitor TVB-2640 compared to NASH patients receiving placebo for 12 weeks (data are shown as violin plot, n = 25 for placebo and n = 28 for TVB-2640, unpaired two-tailed Student’s t test, SAFA: *P = < 0.0001; PUFA: * P = < 0.0001. d Changes in omega-6 (18:2) and omega-3 (20:5; 22:6) fatty acid residues in the TAG fraction of plasma samples from NASH patients treated with placebo (12 weeks placebo) or 50 mg of the FASN inhibitor TVB-2640 (12 weeks TVB-2640) for 12 weeks compared to baseline (0 weeks placebo and 0 weeks TVB-2640) (data are shown as violin plot, n = 25 for placebo and n = 28 for TVB-2640, paired two-tailed Student’s t test, 18:2: * P < 0.0001; 20:5 *P = 0.0350. Source data are provided as a Source Data file.

