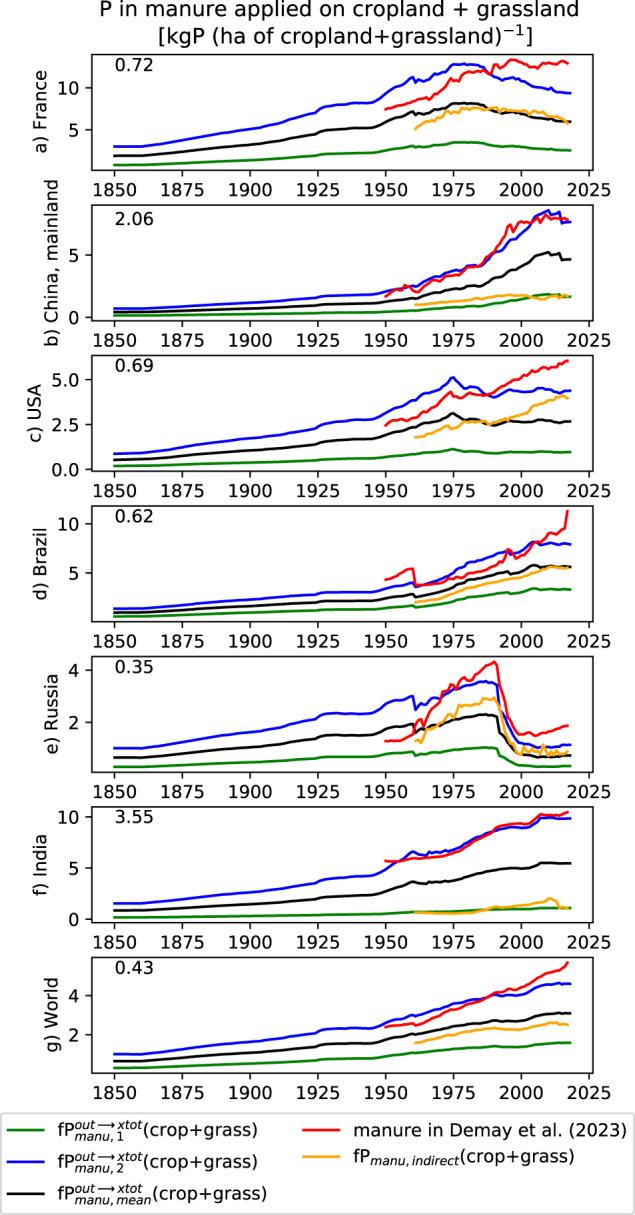
Fig. 3.

Comparison at country-scale between the two estimates of P in manure applied on cropland + grassland used in our approach ( in and ). Temporal country-scale average of Demay et al.9 (red curve) is used to scale the country-scale average of while the year-to-year variability of follows the one of . The mean of our two estimates (subscript ‘mean’) is plotted in black. Independent estimate based on a livestock budget () is also plotted in orange. All fluxes are expressed in kgP (ha of cropland + grassland)−1. Estimate 1 (respectively estimate 2) corresponds to the min (respectively the max) value for all grid-cells within the country considered. “World” in this figure corresponds to the sum of all countries considered in both our estimates and Demay et al.9 and thus excludes few countries not available in Demay et al.9. The number in the left-top corner of each panel corresponds to the root mean square error (in kgP (ha of cropland + grassland)−1) between orange and black curves for years in common.
