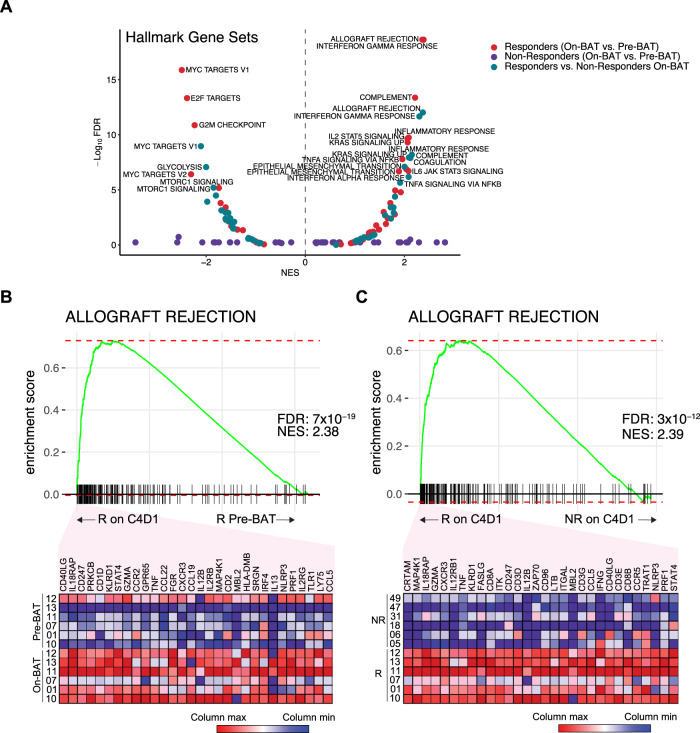
Fig. 4. BAT Induced Changes in Gene Sets Associated With Inflammation.
A Gene set enrichment analyses of HALLMARK gene sets comparing baseline (pre-BAT) to C4D1 (On-BAT) in responders (N = 6; red dots) and non-responders (N = 6;purple dots) or responders to non-responders on C4D1 (On-BAT) (green dots). B Enrichment plot of ALLOGRAFT_REJECTION comparing pre-BAT to On-BAT in responding patients. Top 30 transcripts based on ranked metric scores are shown. C Enrichment plot of ALLOGRAFT_REJECTION comparing responders to non-responders on C4D1. Top 30 transcripts based on ranked metric scores are shown. FDR adj p, p-value adjusted for false discovery rate. ES, enrichment score. NES, normalized enrichment score. This is a two-tailed test where there is a multiple comparison adjustment for the statistics derived from the test (NES, FDR) based on the number of gene sets tested, number of samples and by applying numerous permutations of the gene list supplied and labels assigned to the samples.

