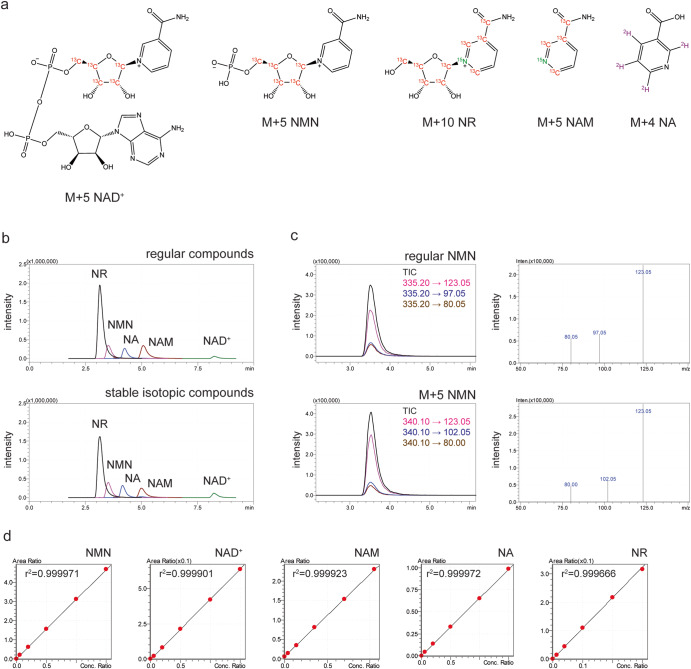
Fig. 1. Isotopic compounds used for LC-MS/MS analysis.
a The structures of stable isotopic compounds used for LC-MS/MS analysis. Atoms in red, green, or purple are stable isotopes. b Chromatograms of regular (upper panel) and stable isotopic (bottom panel) compounds. These regular and isotopic compounds (200 nM for NR and M + 10 NR; 1000 nM for NMN, NA, NAM, NAD+, M + 5 NMN, M + 4 NA, M + 5 NAM, and M + 5 NAD+) were separated by an NMN-2 column newly developed by Shimadzu Corporation. Total Ion Counts (TICs) from the multiple reaction monitoring (MRM) of each compound are shown. c Chromatograms and mass spectra of regular and isotopic NMN. TICs and transitions were obtained as a chromatogram from the MRM of regular and isotopic NMN (left panels), and resultant product ions were displayed as mass spectra (right panels). d Calibration curves of NMN and other related compounds. The area under curves (AUCs) of each regular compound at different ranges of concentrations (0, 60, 200, 500, 1000, and 1500 nM for NMN, NAD+, and NA; 0, 84, 280, 700, 1400, and 2100 nM for NAM; 0, 2.4, 8, 20, 40, and 60 nM for NR) were measured by LC-MS/MS under the existence of a fixed amount (1000 nM for M + 5 NMN, M + 5 NAD+ and M + 4 NA; 2000 nM for M + 5 NAM; 200 nM for M + 10 NR) of each corresponding isotopic compound and normalized to the AUC of each isotopic internal standard.

