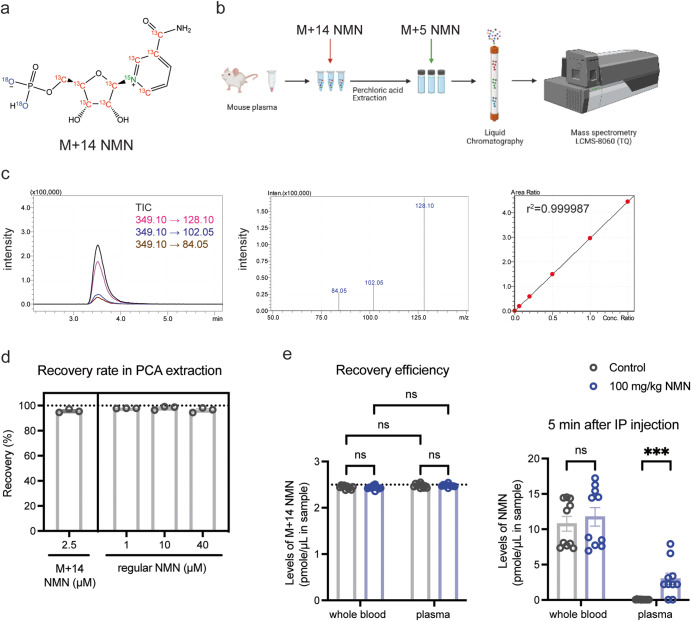
Fig. 3. The double isotope-mediated LC-MS/MS methodology (dimeLC-MS/MS) for NMN measurement.
a The structure of NMN (M + 14) with stable isotopes. Isotopic carbon, nitrogen, and oxygen are shown in red, green, and purple colors, respectively. b The schematic flow of the dimeLC-MS/MS for NMN measurement. M + 14 NMN is added directly to the mouse plasma before extraction by perchloric acid. M + 5 NMN is added to the final, neutralized extract before detection by LC-MS/MS. c The chromatogram, mass spectra, and calibration curve of NMN (M + 14). TICs and transitions were obtained from the MRM of 1000 nM NMN (M + 14) and plotted in a chromatogram (left panel), and corresponding product ions were displayed as mass spectra (middle panel). The calibration curve of NMN (M + 14) was drawn at the range of 0, 60, 200, 500, 1000, and 1500 nM after normalizing its AUCs to those of 1000 nM NMN (M + 5). d Recovery efficiencies of spiked NMN (M + 14) and regular NMN in the dimeLC-MS/MS. NMN (M + 14) and indicated concentrations of regular NMN were added to mouse plasma. Each plasma sample was extracted by PCA and analyzed with dimeLC-MS/MS. Recovery efficiencies were calculated by an iSTD method. Results were obtained from three independent experiments. e NMN levels in mouse whole blood or plasma after NMN IP injection. Three- to four-month-old C57BL/6 J mice (n = 10) were given NMN by IP injection (100 mg/kg). Each sample was extracted by PCA, and NMN was measured by dimeLC-MS/MS. Repeated-measures two-way ANOVA was conducted to compare the results with Bonferroni’s multiple comparisons post hoc test. Data are presented as mean ± SEM. ***p < 0.005.

