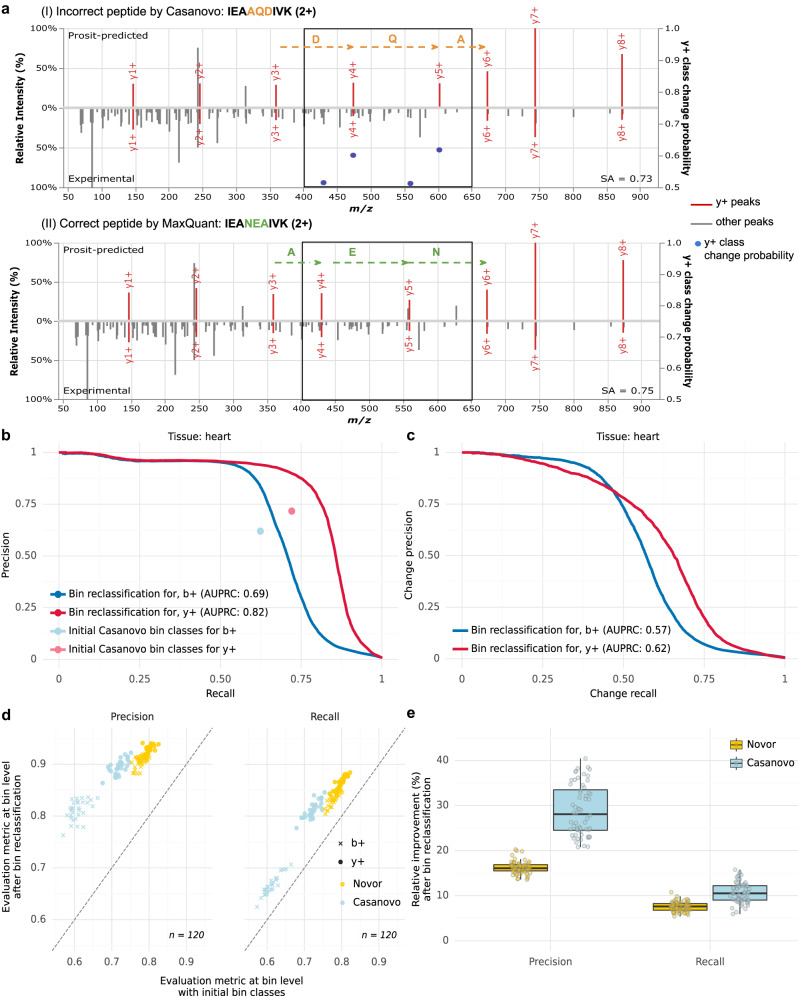
Fig. 2. Bin reclassification performance.
a An example of a bin reclassification: (I) Prosit-predicted spectrum (top) and experimental spectrum (bottom) for an incorrect peptide sequence IEAAQDIVK proposed by Casanovo. Singly charged y-ions (y + ) are colored in red. Bin class change probabilities for y-ions are marked with blue dots (secondary y-axis, cropped at 0.5 to not clutter the plot). (II) Prosit-predicted spectrum (top) and experimental spectrum (bottom) for the correct peptide sequence IEANEAIVK identified by MaxQuant at 1% FDR. The region where ion series label predictions differ between (I) and (II) is delimited with boxes. Incorrect residues are marked in orange. The residues differing in the correct sequence are marked in green. The spectral angle (SA) between the experimental and Prosit-predicted spectrum is indicated for both peptide sequences. b Precision-recall curves for bin reclassification of b-ions and y-ions after relabeling initial bin classes proposed by Casanovo on the test set of the heart sample compared to the precision and recall computed at bin level for the initial bin class labeling. The average precision-recall is denoted as AUPRC. c As in (b) for change-precision-recall curves. d Precision (left) and recall (right) after bin reclassification against before when using Novor (yellow) or Casanovo (blue) for the initial peptide. Data on test sets across all n = 30 samples (different tissues). e Distribution of relative improvement of precision and recall after bin reclassification on the test sets of all n = 30 samples (different tissues) over Novor and Casanovo for b-ions and y-ions. The data in (e) are represented as boxplots in which the middle line indicates the median, the bounds of the box indicate the first and third quartiles and the whiskers indicate ±1.5 × IQR (interquartile range) from the third and first quartile, respectively. Source data are provided as a Source Data file.

