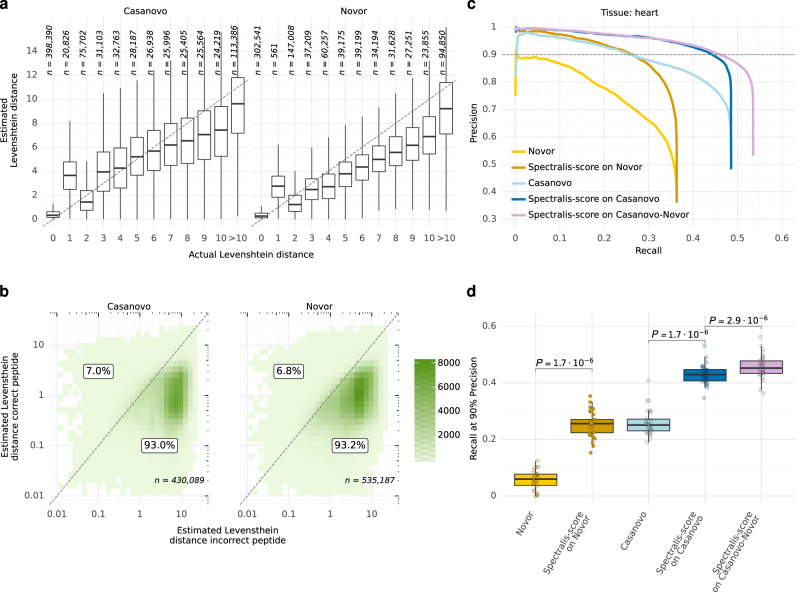
Fig. 4. Levenshtein distance estimator performance.
a Estimated against actual Levenshtein distances of incorrect peptide identifications by Novor and Casanovo to the correct peptide sequence by MaxQuant across all 30 human samples. b Estimated Levenshtein distances of incorrect peptides against the estimated Levenshtein distances of the corresponding correct peptide sequences for a given spectrum across all 30 samples. The percentage of points above or on the diagonal line and below the diagonal line is labeled. c Precision-recall curves at peptide level before and after rescoring peptide identifications by Novor and Casanovo on the heart sample with Spectralis-score, our Levenshtein distance estimator, including the precision and recall for peptides from Casanovo with Novor substitutes for peptides with wrong mass (Casanovo-Novor). d Recall at 90% precision before and after rescoring peptides from Novor, Casanovo, as well as the combination of Casanovo and Novor sequences (Casanovo-Novor) across all n = 30 samples (different tissues). Statistical significance from a two-sided paired Wilcoxon test. The data in (a) and (d) are represented as boxplots in which the middle line indicates the median, the bounds of the box indicate the first and third quartiles and the whiskers indicate ±1.5 × IQR (interquartile range) from the third and first quartile, respectively. Source data are provided as a Source Data file.

