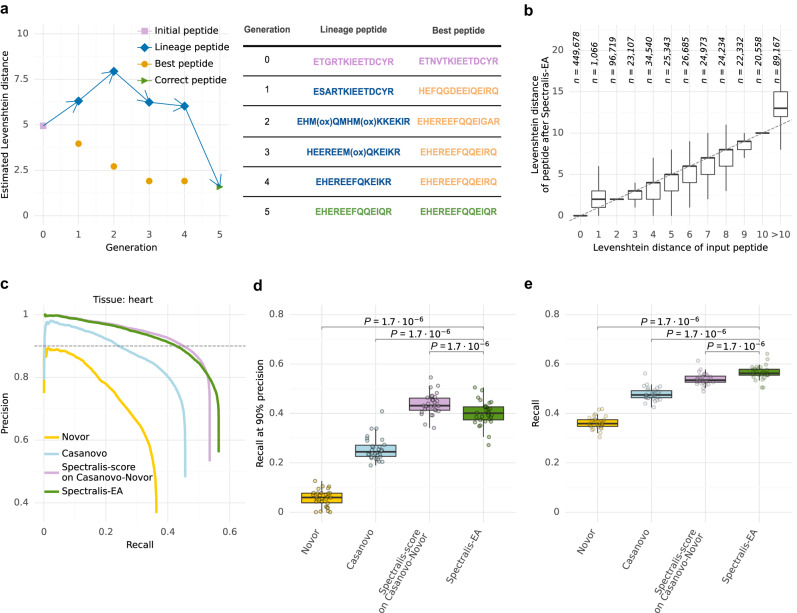
Fig. 5. Spectralis-EA performance.
a Example of a successful optimization of the initially incorrect peptide sequence ETGRTKIEETDCYR predicted by Novor after 5 generations of the evolutionary algorithm. For each generation, the estimated Levenshtein distances are provided for the best peptide (i.e., most highly scored peptide), and the lineage peptide (i.e. the candidate peptide leading to the correct peptide sequence). b Levenshtein distances of input peptide sequences against Levenshtein distances of peptide sequences returned by Spectralis-EA. c Precision-recall curves of identifications at peptide level for Novor, Casanovo, and Spectralis-EA, as well as Spectralis-score on the combination of Casanovo and Novor sequences (Casanovo-Novor) on the test set of the heart sample. d Recall at 90% precision for Novor, Casanovo, Spectralis-score on the combination of Casanovo and Novor (Casanovo-Novor) and Spectralis-EA on the test sets of all 30 samples. e Overall recall for Novor, Casanovo, Spectralis-score on Casanovo-Novor, and Spectralis-EA on the test sets of all n = 30 samples (different tissues). Statistical significance for (d) and (e) from a two-sided paired Wilcoxon test. The data in (b), (d) and (e) are represented as boxplots in which the middle line indicates the median, the bounds of the box indicate the first and third quartiles and the whiskers indicate ±1.5 × IQR (interquartile range) from the third and first quartile, respectively. Source data are provided as a Source Data file.

