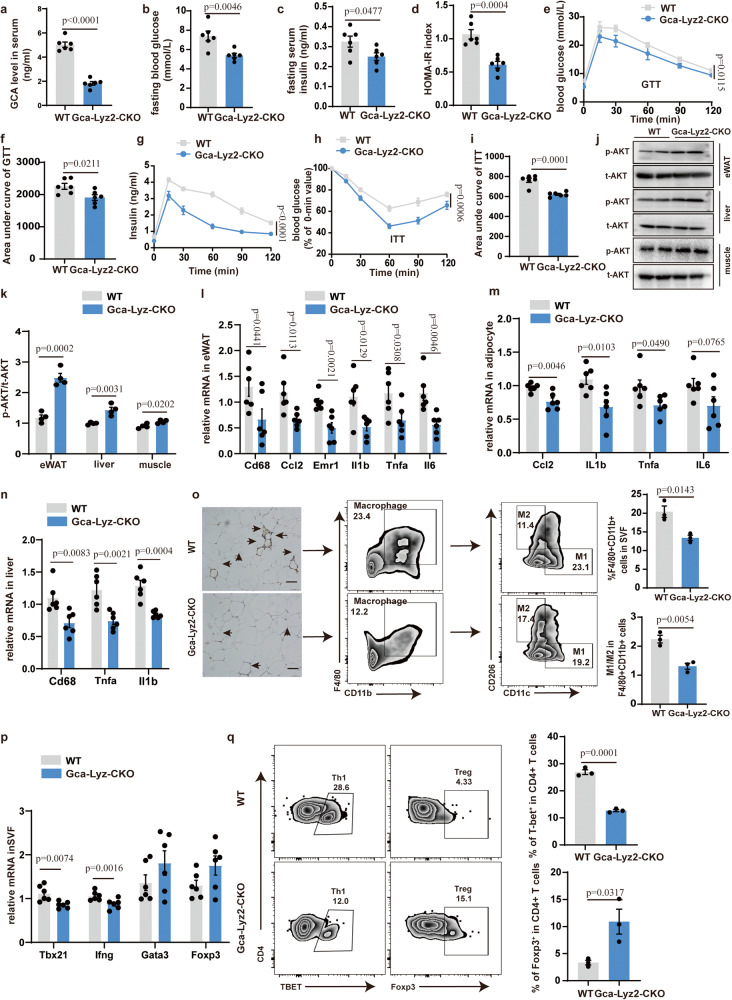
Fig. 2. GCA deficiency in myeloid lineage ameliorates adipose tissue inflammation and glucose metabolism.
a Serum GCA concentrations in Gca-Lyz2-CKO and WT mice (n = 6). b–d Fasting blood glucose, fasting insulin and HOMA-IR index of Gca-Lyz2-CKO and WT mice fed with HFD for 12 weeks (n = 6). e, f Blood glucose (e) and area under curve (f) of Gca-Lyz2-CKO and wild type (WT) mice fed with HFD for 12 weeks during intraperitoneal glucose tolerance test (GTT) (n = 6). g Serum insulin concentrations during GTT (n = 6). h Blood glucose in Gca-Lyz2-CKO and WT mice fed with HFD for 12 weeks during intraperitoneal insulin tolerance test (ITT) (n = 6). i Area under curve (AUC) of Gca-Lyz2-CKO and WT mice fed with HFD for 12 weeks during ITT (n = 6). The values of the y-axis in AUC are the absolute measured blood glucose concentrations. j, k Western Blot of insulin-stimulated AKT phosphorylation in epidydimal white adipose tissue (eWAT), liver and muscle j and quantitation of pAKT/tAKT k from Gca-Lyz2-CKO and WT mice fed with HFD for 12 weeks (n = 4). l–n Quantitative Polymerase Chain Reaction (QPCR) analysis of inflammatory cytokine gene expression levels in eWAT, adipocyte and liver of Gca-Lyz2-CKO and WT mice fed with HFD for 12 weeks (n = 6). o F4/80 immunohistochemistry and flow analyses of macrophage in eWAT from Gca-Lyz2-CKO and WT mice fed with HFD for 12 weeks (n = 3). Scale bar, 250 µm. p QPCR analysis of the proinflammatory Th1 marker genes (Tbx21 and Ifng), Treg (Foxp3) and Th2(Gata3) in SFV of Gca-Lyz2-CKO and WT mice fed with HFD for 12 weeks (n = 6). q Flow cytometry analysis of CD4+Tbet+ Th1 cells and CD4+Foxp3+ Treg cells in eWAT from Gca-Lyz2-CKO and WT mice fed with HFD for 12 weeks (n = 3). Data are presented as means ± SEM. n indicates the number of biologically independent samples examined. Statistical analysis was assessed by two-sided Student’s t test (a–d, f, i and k–q) or two-way ANOVA followed with Sidak’s multiple comparisons test (e,g and h) and significant differences were indicated with p values. Source data are provided as a Source Data File.

