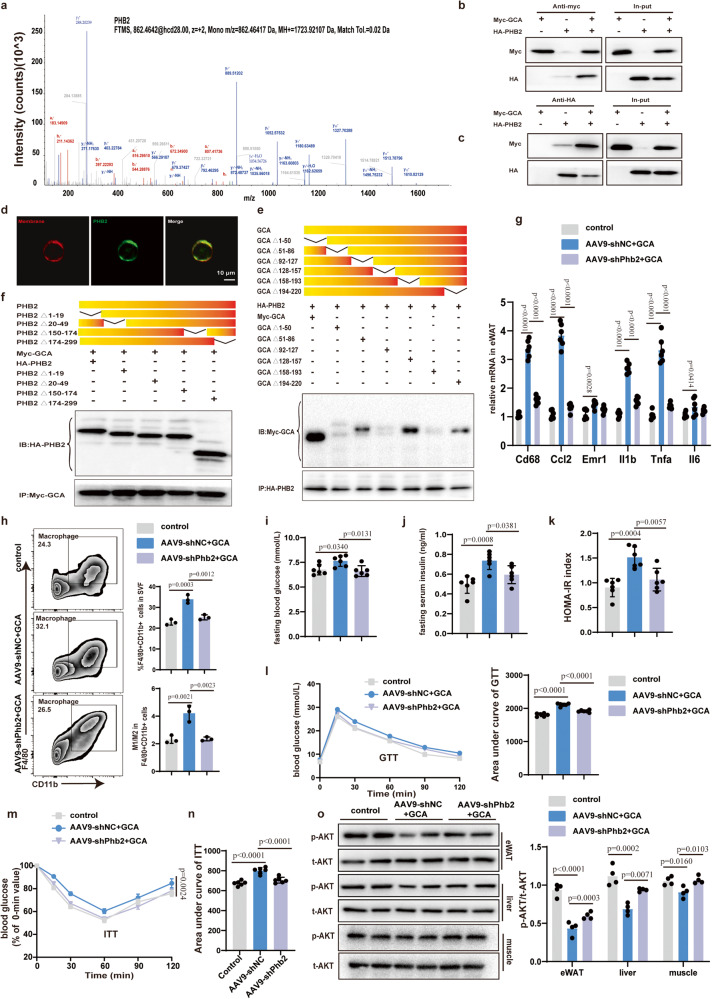
Fig. 6. PHB2 is a functional receptor of GCA in adipocyte.
a The mass spectrum of prohibitin 2 (PHB2). b–c Immunoprecipitation (IP) analysis of Myc-GCA (b) and HA-PHB2 (c) binding. d Immunofluorescent staining of PHB2(green) in differentiated 3T3-L1. The cytoplasmic membrane was stained with Dil (red). Scale bars, 10 μm. e IP analysis of various GCA deletion mutants and their binding to full-length PHB2. f IP analysis of various PHB2 deletion mutants and their binding to full-length GCA. g QPCR analysis of inflammatory cytokine gene expression levels in eWAT of control mice and Phb2 knockdown mice with or without GCA treatment (n = 6). h Flow analyses of macrophage in eWAT from control mice, AAV9-shNC mice and AAV9-shPhb2 mice treated with GCA or PBS for 8 weeks (n = 3). i–k Fasting blood glucose, fasting insulin and HOMA-IR index of control mice, AAV9-shNC mice and AAV9-shPhb2 mice treated with GCA or PBS for 8 weeks (n = 6). l, m GTT and ITT of control mice, AAV9-shNC mice and AAV9-shPhb2 mice treated with GCA or PBS for 8 weeks (n = 6). (n) AUC of ITT (n = 6), in which the values of the y-axis are the absolute measured blood glucose concentrations. o Western Blot of insulin-stimulated AKT phosphorylation in eWAT, liver and muscle(left) and quantitation of pAKT/tAKT(right) from control mice, AAV9-shNC mice and AAV9-shPhb2 mice treated with GCA or PBS for 8 weeks (n = 4). Data are presented as means ± SEM. n indicates the number of biologically independent samples examined. Data shown in b, c, d, e, f are representative images of three independent experiments with similar results. Statistical analysis was assessed by one-way ANOVA with Tukey’s multiple-comparison test (g–k, l (right), n, o (right) or two-way ANOVA followed with Sidak’s multiple comparisons test (m) and significant differences were indicated with p values. Source data are provided as a Source Data File.

