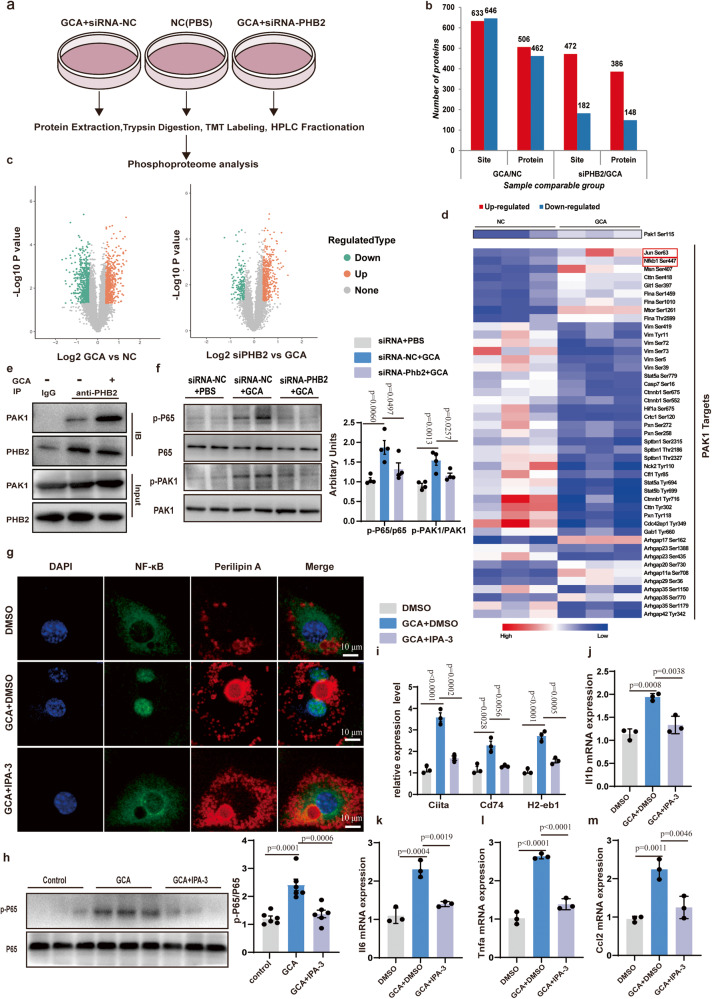
Fig. 7. GCA promotes phosphorylation of PAK1- NF-κB downstream of PHB2 signaling.
a Global quantitative phosphoproteomic analysis using differentiated 3T3-L1 adipocytes treated with GCA, PBS, or siRNA-PHB2. b–c Statistics (b) and volcano plot (c) of dysregulated phosphorylations. d Heatmap of the p21-activating kinase (PAK1) and its targets phosphorylation levels in the indicated groups. e Images of immunoprecipitation (IP) analysis using antibody target PHB2 followed by western blotting analysis using antibodies target PAK1 and PHB2. Data shown are representative images of three independent experiments with similar results. f Representative images of western blotting analysis of proteins/phosphorylations as indicated in differentiated 3T3-L1 adipocytes treated with GCA or siRNA-PHB2 (n = 3). g Representative immunofluorescent images of P65 (green) and Perilipin A(red) in differentiated 3T3-L1 adipocytes with addition of 10 μM IPA-3(PAK1 inhibitors) or DMSO and with or without GCA treatment (n = 3). The nuclei were stained with DAPI. (n = 4). Scale bar, 10 μm. h Representative images of western blotting analysis of p-P65(left) and quantitation of p-P65/P65(right) in differentiated 3T3-L1 adipocytes with addition of 10 μM IPA-3(PAK1 inhibitors) or DMSO and with or without GCA treatment (n = 6). i QPCR analysis of MHCII family genes in differentiated 3T3-L1 adipocytes with addition of IPA-3 or DMSO and with or without GCA treatment (n = 3). j–m QPCR analysis of Il1b(j), Il6 (k), Tnfa (l) and Ccl2 (m) in differentiated 3T3-L1 with addition of IPA-3 or DMSO and with or without GCA treatment (n = 3). Data are presented as means ± SEM. n indicates the number of biologically independent samples examined. Statistical analysis was assessed by two-sided Student’s t test (c) or one-way ANOVA with Tukey’s multiple-comparison test (f and h–m) and significant differences were indicated with p values. Source data are provided as a Source Data File.

