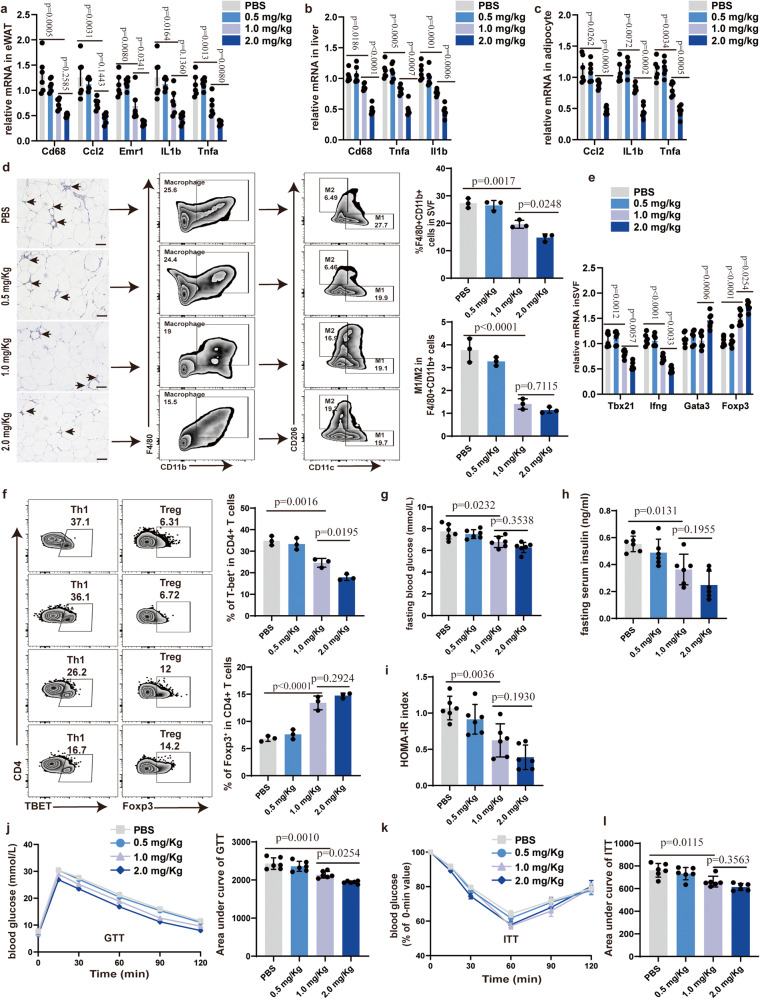
Fig. 8. GCA-neutralizing antibody (GCA-NAb) improves adipose tissue inflammation and insulin sensitivity in obese mice.
a–c Inflammatory gene expression in eWAT(a), liver(b) and adipocyte(c) from DIO mice treated with PBS or different concentrations of GCA-NAb for 2 months (n = 6). d F4/80 immunohistochemistry and flow analyses of macrophage in eWAT from DIO mice treated with PBS or different concentrations of GCA-NAb for 2 months (n = 3). e Gene expression in SVF from diet-induced obesity (DIO) mice treated with PBS or different concentrations of GCA-NAb for 2 months (n = 6). f Flow cytometry analysis of CD4+Tbet+ Th1 cells and CD4+Foxp3+ Treg cells in eWAT from DIO mice treated with PBS or different concentrations of GCA-NAb for 2 months (n = 3). g–i Fasting blood glucose, fasting insulin and HOMA-IR index of DIO mice treated with PBS or different concentrations of GCA-NAb for 2 months (n = 6). j–k GTT and ITT of DIO mice treated with PBS or different concentrations GCA-NAb for 2 months (n = 6). The values for the GTT graph are the absolute measured blood glucose concentrations, but for the ITT graph, the values for each different group represent the percentage of the initial measured blood glucose concentration at time 0 for that group. l AUC of ITT, in which the values of the y-axis are the absolute measured blood glucose concentrations (n = 6). Data are presented as means ± SEM. n indicates the number of biologically independent samples examined. Statistical analysis was assessed by one-way ANOVA with Tukey’s multiple-comparison test and significant differences were indicated with p values. Source data are provided as a Source Data File.

