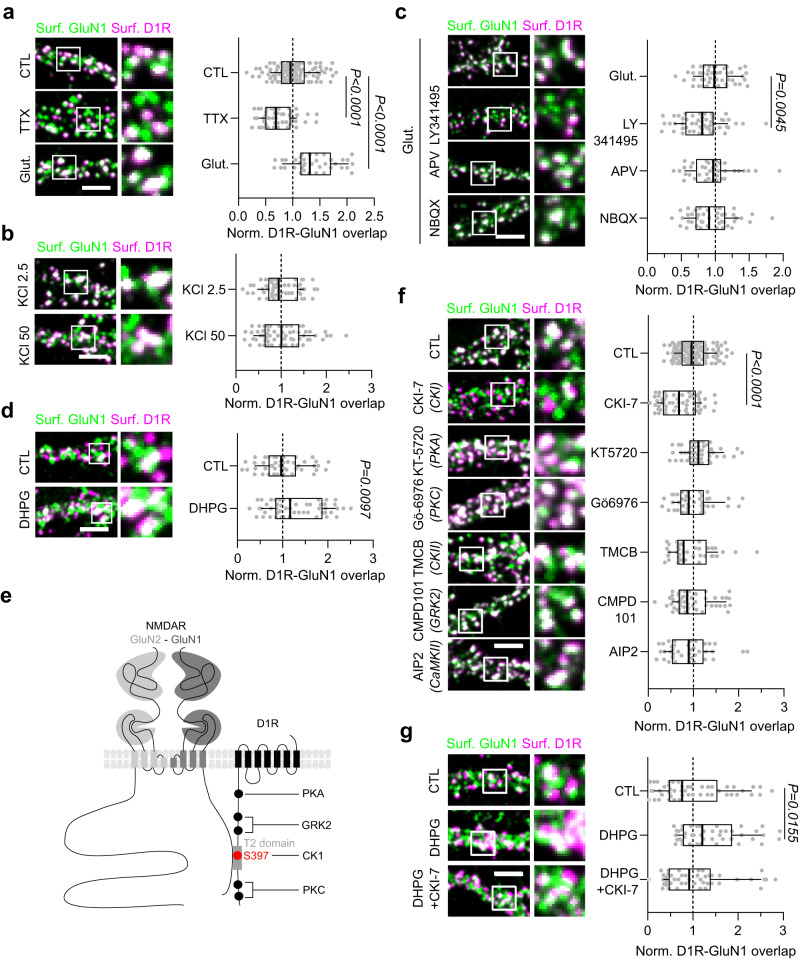
Fig. 4. GluN1-D1R interaction is activity-dependent and increased by the phosphorylation of D1R by casein kinase 1 (CK1).
a–d Representative images of hippocampal dendrites on which surface GluN1-NMDAR (green) and D1R (magenta) were labeled after exposures to various pharmacological treatments with respective quantification of D1R-GluN1-NMDAR mean overlap, (a) Buffer (CTL, n = 105 fields), TTX (1 µM, n = 49) and glutamate (50 µM, n = 37); (b) KCl 2.5 mM (CTL, n = 55) or KCl 50 mM (n = 60); (d) Buffer (CTL, n = 47) or DHPG (50 µM, n = 51); (c) glutamate alone (n = 47) or together with APV (50 µM, n = 40), LY-341495 (100 µM, n = 52) or NBQX (2 µM, n = 43) (a, c One-way ANOVA with Dunnett’s post hoc test; b-d, two-tailed unpaired t-test). Scale bar, 5 µm. Results are normalized to CTL (a, b, d) or glutamate (c). e Cartoon illustrating putative D1R phosphorylation sites. f Representative images of hippocampal dendrites on which surface GluN1-NMDAR (green) and D1R (magenta) were labeled after exposures to various kinase inhibitors with respective quantification of the normalized GluN1-NMDAR-D1R mean overlap in control (CTL) condition (n = 126 fields) or following acute treatment with CKI-7 (100 µM, n = 57), KT-5720 (25 µM, n = 49), Gö−6976 (1 µM, n = 41), TMCB (5 µM, n = 37), CMPD101 (1 µM, n = 50) and AIP2 (1 µM, n = 40; One-way ANOVA with Dunnett’s post-hoc test). Scale bar, 5 µm. g Representative images of hippocampal dendrites on which surface GluN1-NMDAR (green) and D1R (magenta) were labeled after treatment with buffer (CTL, n = 48 fields), DHPG alone (50 µM, n = 44) or together with CKI-7 (100 µM, n = 45) with respective quantification of D1R-GluN1-NMDAR mean overlap (One-way ANOVA with Dunnett’s post-hoc test). Scale bar, 5 µm. Data are presented as box-and-whisker plots: line at median, IQR in box, whiskers represent 10–90 percentile. Source data are provided as a Source Data file.

