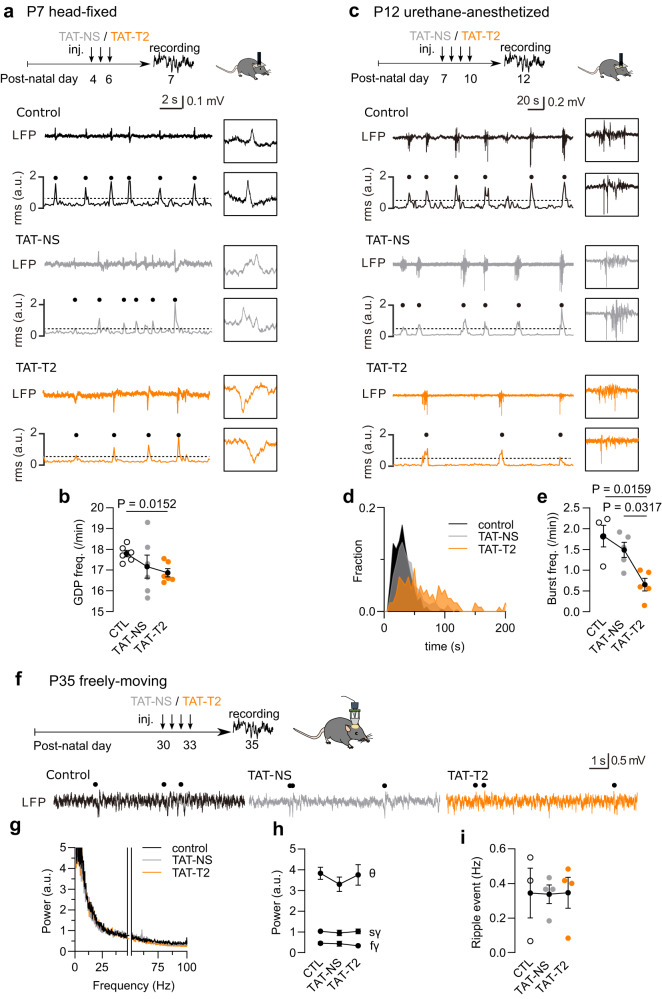
Fig. 7. GluN1-D1R interaction is required for early basal network activity in vivo.
a Experimental timeline for P7 head-fixed mice with representative LFP traces and the corresponding root mean square (RMS) in control (CTL), TAT-NS and TAT-T2 injected mice. b Comparison of the frequency of GDP events (n = 6 mice per group; two-tailed Mann–Whitney U test). Data are presented as mean +/- SEM. c Experimental timeline for P12 urethane-anesthetized mice with representative LFP traces and the corresponding root mean square (RMS) in control (CTL), TAT-NS, and TAT-T2-injected mice. d Distributions of inter-LB intervals. e Comparison of the frequency of LB events (n = 4-5 mice per group; two-tailed Mann–Whitney U test). Data are presented as mean +/- SEM. f Experimental timeline for P35 freely moving mice and representative LFP traces in control, TAT-NS and TAT-T2-injected mice. Hippocampal ripple events are indicated by black dots (above the traces). g, h Comparison of fast Fourier Transform (FFT) plots of LFP activity at 1–100 Hz bands excluding 48-52 Hz, (n = 3–4 mice per group). Data are presented as mean +/- SEM. i Comparison of the frequency of ripple events (n = 3–4 mice per group; two-tailed Mann-Whitney U test). Data are presented as mean +/- SEM. Source data are provided as a Source Data file.

