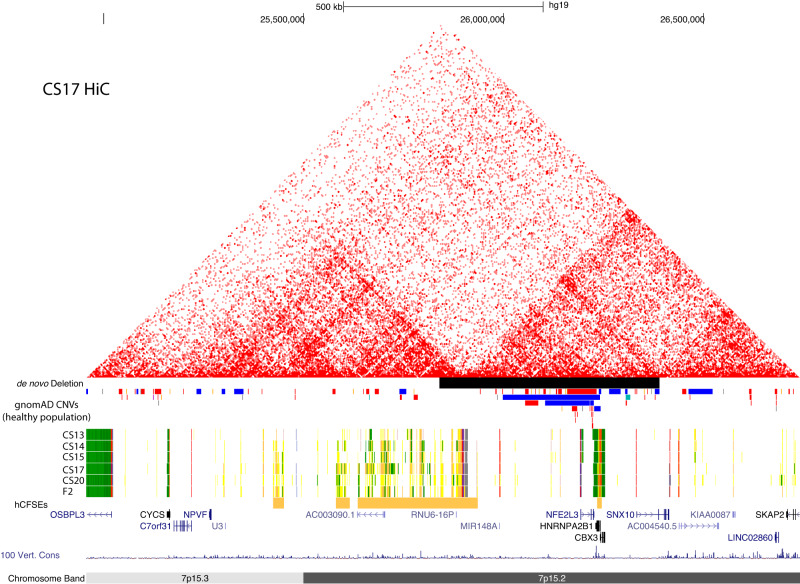
Fig. 8. Location of de novo deletion overlapping GCR.
Browser image (hg19) showing de novo deletion presented by the group at Ghent University corresponding to Chr7:25,839,621-26,389,620 on the hg19 assembly. Also shown are the UCSC Browser tracks for the 25-state model, human embryonic craniofacial superenhancers and gnomAD Structural Variation track filtered to show CNVs >300 bp. Colors in the gnomAD track are as they appear in the UCSC genome browser, red bars signify deletions and blue bars duplications.

