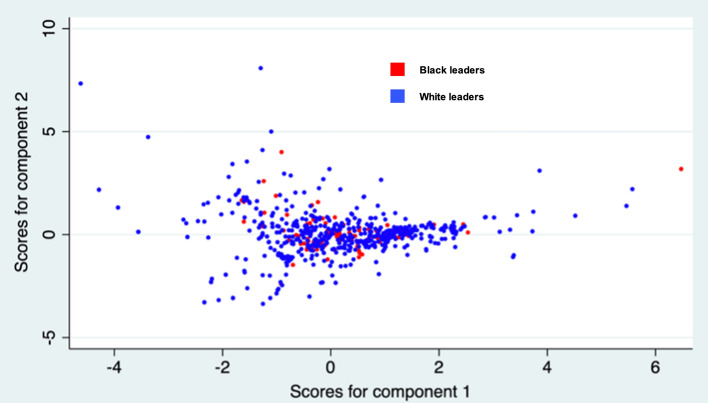
Figure 5.
Two-dimensional Factor Mapping of the Relative Topic Distancing. Note Red dots represent Black (minority) female leaders and White (majority) leaders are captured by blue dots. Figure 5 displays the results of a factor analysis, where “Component 1” and “Component 2” are the first two principal components capturing the most significant underlying patterns in the data. These components, derived from the original 35 behavioural schemas identified through the topic modelling, simplify the topic modelling output complexity into a 2-dimensional graph.

