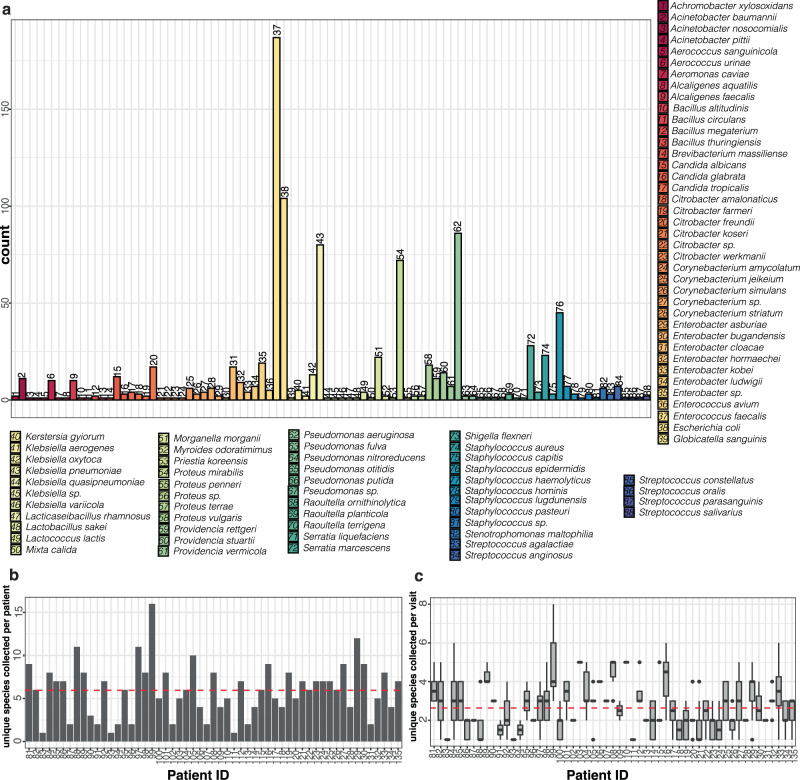
Fig. 3. The polymicrobial community composition of long-term catheterized patients averages 5–6 species per patient but only 2–3 species per collection period and are dominated by species that are frequently uropathogenic.
a Number of occurrences of indicated species per patient per collection period detected in the catheter and/or urine samples in the long-term catheterization cohort. Numbers above bars correspond to numbered species key. b The number of unique species identified per patient. Average (mean) of species identified across all patients (n = 55) is indicated by a dashed red line. c Boxplots of the number of unique species identified per patient per collection period. The bottom and top ends of the gray rectangle indicate the lower and upper quartile for the number of species identified per collection, respectively, with the median indicated within the rectangle. The whiskers indicate the maximum and minimum species detected that are not outliers (within 1.5× the interquartile range). For patients with 2 or fewer collection periods, the number of unique species identified are indicated by dots. Average (mean) of species identified across all collection periods (n = 366) is indicated by a dashed red line. Source data are provided as a Source Data file.

