Figure 2.
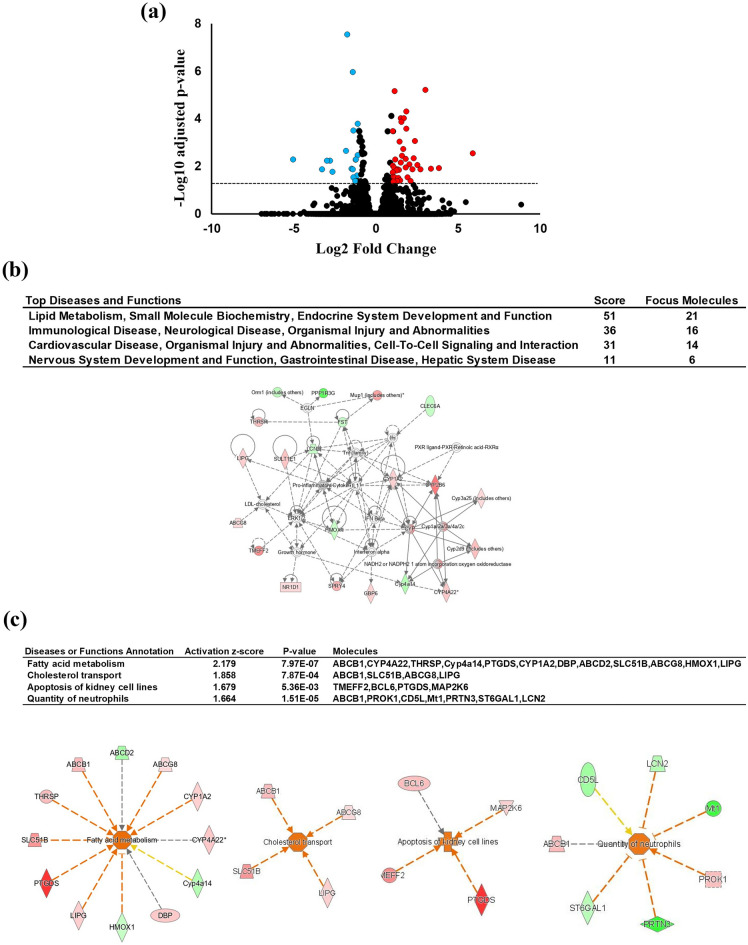
Results of liver RNA-Seq and IPA between HF and HFA-fed mice (n = 3). (a) Volcano plot of DEGs. The red circle indicates the genes with significantly increased expression (fold change more than 1 and adjusted P-value < 0.05) in HFA-fed mice compared with HF-fed mice. The blue circle indicates the genes with decreased expression (fold change less than − 1 and adjusted P-value < 0.05) in HFA-fed mice compared with in HF-fed mice. The horizontal line indicates the value of 1.30, corresponding to the adjusted P-value = 0.05. (b) Hepatic gene interaction network analysis in response to ASHE supplementation using IPA software. “Disease and functions” is the top four ranked-highest network. The score is based on the observed direction of target expression in the data set and the expected disease impact and function downstream indicated by the literature. The intensity of the node color indicates the magnitude of upregulation (red) or downregulation (green). Solid arrow: induction or activation or both; dashed arrow: suppression or inhibition or both. (c) Hepatic gene interaction and biological ontology analysis in response to ASHE supplementation using IPA software. “Disease and functions” annotation is the top-ranked highest ontology. The figure shows the “fatty acid metabolism” network with the highest activation z-score (2.179). The node color intensity indicates the magnitude of increased (red) or decreased gene expression (green). The orange arrow leads to activation, and the yellow arrow indicates findings inconsistent with the state of the downstream molecule, and gray arrow indicates the effect was not predicted. These images (b,c) were created using Ingenuity Pathway Analysis software (IPA, version 68752261; QIAGEN Inc., https://www.qiagenbioinformatics.com/products/ingenuity-pathway-analysis)39.

