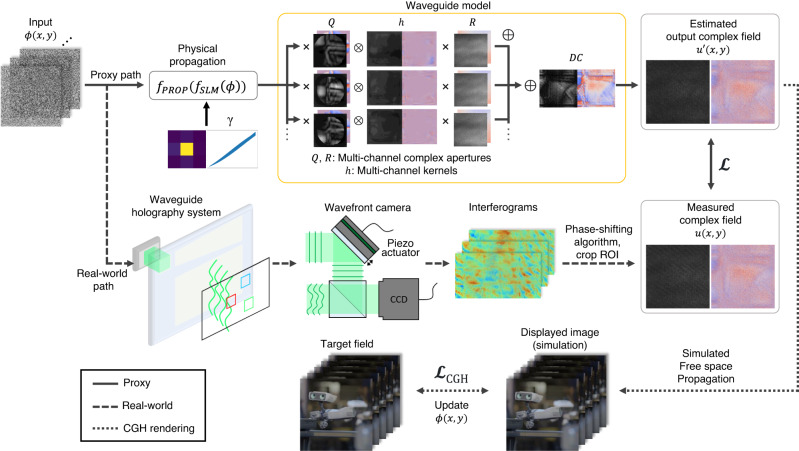
Fig. 2. Illustration of our modeling pipeline.
The upper part represents the proxy path that models the waveguide propagation system, while the middle part represents the real-world path that demonstrates the experimental pipeline to measure the out complex wavefront from the waveguide, which is used to generate the dataset for model calibration. Once the model is calibrated, a free space propagation can be added to render the CGH. Robot images are rendered by Tech Art team in Meta.

