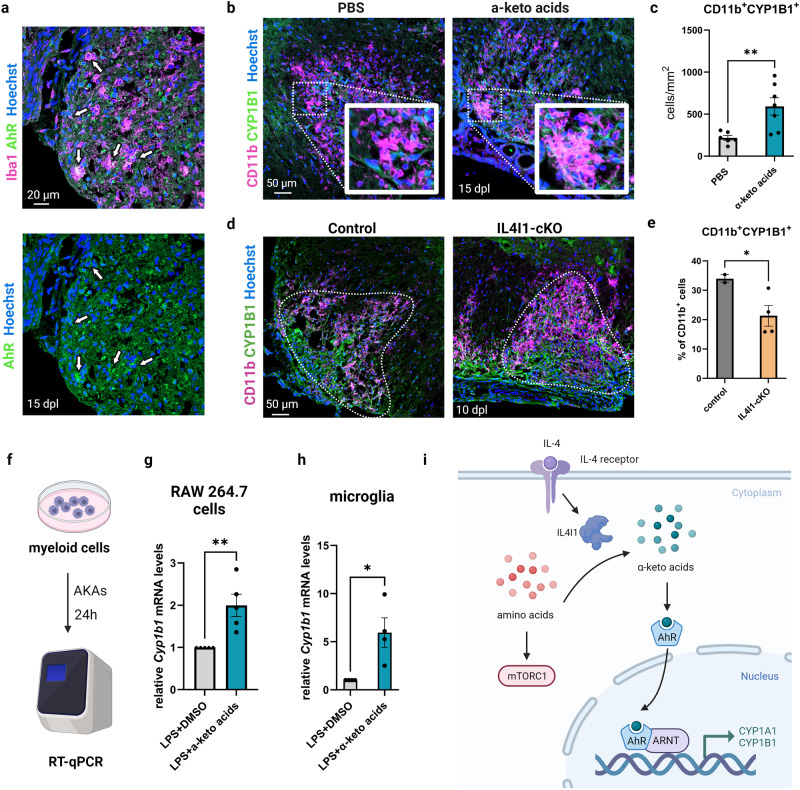
Fig. 7. AKAs stimulate AhR signaling in myeloid cells.
a Representative images of immunostaining for Iba1 (myeloid cell marker) and AhR (aryl hydrocarbon receptor) in lesions from PBS-treated control mice at 15 dpl. Arrows pointing at Iba1+AhR+ cells. The scale bar represents 20 μm. b Representative images of immunostaining for CD11b (myeloid cell marker) and CYP1B1 (AhR activity indicator) in the lesions from PBS-treated and AKA-treated mice. The scale bar represents 50 μm. c Quantification of CD11b+CYP1B1+ cells in lesions from PBS-treated and AKA-treated mice (n = 6–7 mice, unpaired t test). Bars represent the means with SEM. Each point represents an individual value. d Representative image of CD11b and CYP1B1 immunostaining on control and IL4I1-cKO lesions at 10 dpl. The scale bar represents 50 μm. e Quantification of the percentage of CD11b+CYP1B1+ cells over all CD11b+ cells in the lesions (n = 2–4 mice, unpaired t test). f Schematic of AKA treatment on myeloid cells for RT-qPCR. g–h qRT-PCR of Cyp1b1 mRNA expression normalized to housekeeping genes (Rpl13a and Ppia) on control or AKA-treated RAW 264.7 cells (n = 5) and microglia (n = 4 independent replicates, unpaired t test). i A model of IL4-IL4I1-AKAs-AhR axis in myeloid cells during remyelination. Bars represent the means with SEM. Each point represents an individual experiment. *P < 0.05, **P < 0.01.

