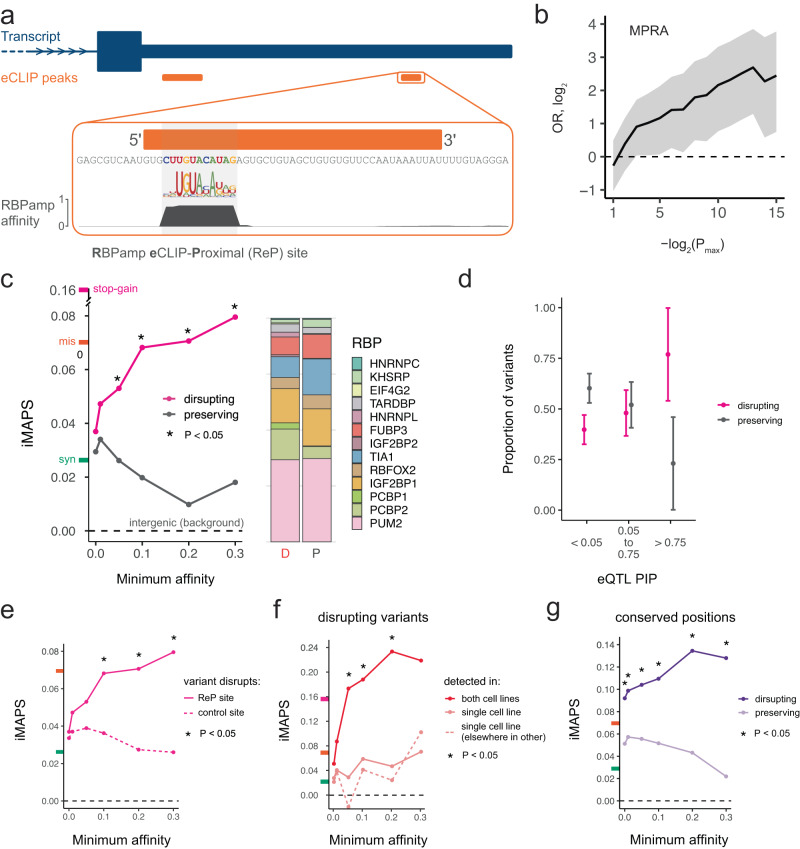
Fig. 2. Variants disrupting ReP sites in 3ʹ UTRs are under strong negative selection.
a A ReP site is the highest affinity RBP binding site at an eCLIP peak for that RBP. b ReP site variants are enriched for significant transcript abundance modulating activity in a massively parallel reporter assay (MPRA) of 3ʹ UTR variants46. Data are presented as odds ratios with 95% confidence intervals. P values were obtained from Griesemer et al.46. OR = odds ratio. Pmax = P value significance threshold. c Variants disrupting RBP affinity / binding at ReP sites are under stronger selection than those that preserve affinity / binding. The stacked bar plot shows the proportion of variants found within each RBP’s ReP sites. “D” = disrupting, “P” = preserving. iMAPS scores for synonymous (green), missense (orange), and/or stop-gain (pink) coding variants are shown on y-axis here and in e-g for reference. d High PIP (likely causal) eQTL variants in ReP sites are much more likely to be disrupting than preserving. Data are presented as proportions with error bars indicating 95% confidence intervals. e Variants disrupting ReP sites are under stronger selection than those disrupting the control site with closest affinity in each gene. The dashed line at 0 indicates background levels of intergenic selection. f Variants disrupting ReP sites detected by eCLIP in both cell lines are under stronger selection than variants disrupting ReP sites detected in only one cell line. Dashed line is data for a control set of ReP sites detected in both cell lines but at different positions in the same 3ʹ UTR. g At highly conserved positions (phastCons 100-way = 1.0), variants disrupting ReP sites are under stronger selection than those that preserve RBP affinity/binding. Asterisks (*) indicate one-sided Fisher Exact Tests with P < 0.05. Exact P values and the number of variants available for analysis are included in Supplementary Data 1.

