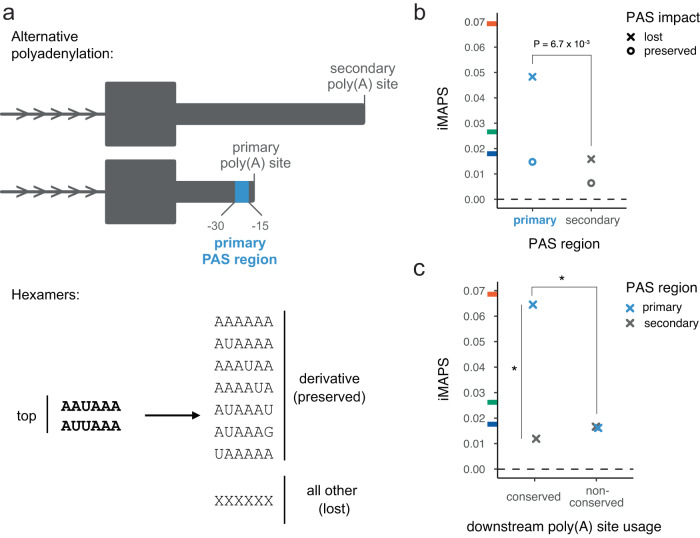
Fig. 5. Negative selection on PASs in 3ʹ UTRs.
a Schematic of polyadenylation sites in 3ʹ UTRs. Top: the primary PAS region for a given gene (associated with the most commonly used poly(A) site) is shown in blue. AWUAAA hexamers found in any other regions (gray) are considered secondary. Bottom: Canonical / top PAS hexamers match AWUAAA. A PAS is considered preserved if the variant results in a canonical or derivative PAS hexamer, otherwise it is considered lost. b PAS loss in primary PAS regions is under stronger selection than PAS lost in secondary regions. n = 1,571 variants for lost PAS in primary regions and n = 14,867 variants for lost PAS in secondary regions. A one-sided Fisher Exact Test P value is shown. c PAS loss in primary regions is under stronger selection when the downstream poly(A) site is also utilized in mouse or rat (i.e. “conserved”). n = 1041 variants for primary conserved, 2928 for secondary conserved, and 530 for primary non-conserved. Asterisks (*) indicate one-sided Fisher Exact Tests with P < 0.05. Primary & conserved vs. secondary & conserved P = 0.0016. Primary & conserved vs. primary & non-conserved P = 0.035. Tick marks on the y-axis indicate the genome-wide average iMAPS for 3ʹ UTR (blue), synonymous coding (green), and missense coding (orange) variants. The dashed line at 0 indicates background levels of intergenic selection.

