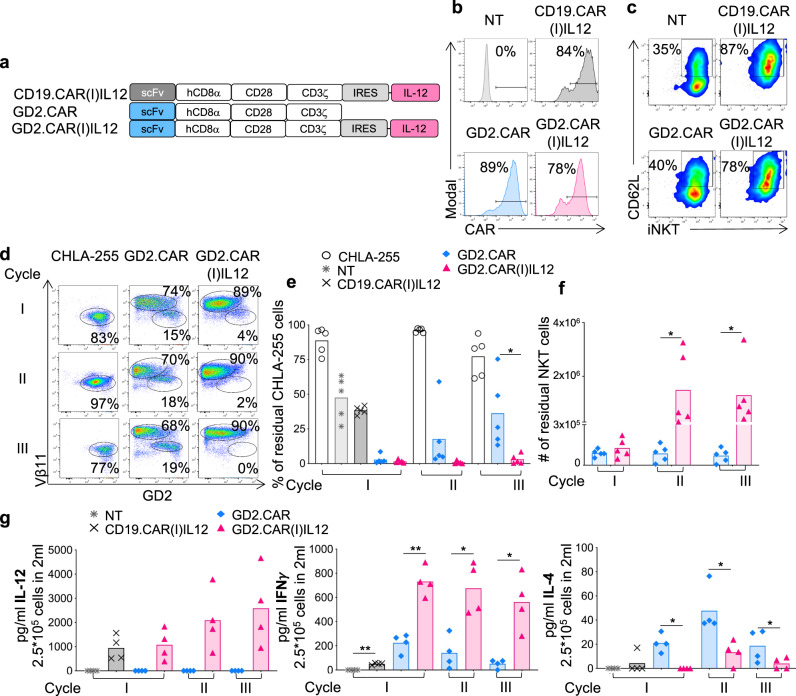
Fig. 5. GD2.CAR(I)IL12 NKTs are superior to GD2.CAR-NKTs in eliminating tumor cells in stress conditions in vitro and acquire a pro-inflammatory phenotype.
a Schematic of the retroviral vectors encoding the CD19.CAR or GD2.CAR and IL-12 used to transduce NKTs. b Representative flow cytometry plots of 8 donors showing the CAR expression in control (NT) and CAR-NKTs assessed at day 14 of culture. c Representative flow cytometry plots of 8 donors showing the CD62L expression in NT and CAR-NKTs assessed at day 14 of culture. d–f Representative flow cytometry plots (d), and summary of the quantification of residual tumor cells (e) and NKTs (f) after each cycle when NKTs were co-cultured with CHLA-255 (E:T = 1:1). Cells were collected and stained with anti-iTCR (Vβ11) and anti-GD2 Abs to identify NKTs and neuroblastoma cells, respectively, by flow cytometry. Mean is shown; n = 5 donors; *p = 0.0458 cycle III, % tumor cells; # of NKTs; p = 0.0457 cycle II and III; two-way ANOVA. Source data are provided as a Source Data file. g Quantification of IL-12, IFN-γ and IL-4 produced by NT, CD19.CAR(I)IL12, GD2.CAR and GD2.CAR(I)IL12 NKTs when cocultured with CHLA-255 at E:T ratio 1:1. Cytokines were measured in supernatants collected 24 h after plating 2.5 × 10⁵ NKT cells/well with 2.5 × 10⁵ CHLA-255/well in 24 well plate in 2 mL of complete media without cytokines. Mean is shown; n = 4 donors; IFN **p = 0.0010, **p = 0.0037, *p = 0.0387, *p = 0.0239; IL-4, *p = 0.0110, * p = 0.0152, *p = 0.0438; two-tailed paired t test. Source data are provided as a Source Data file.

