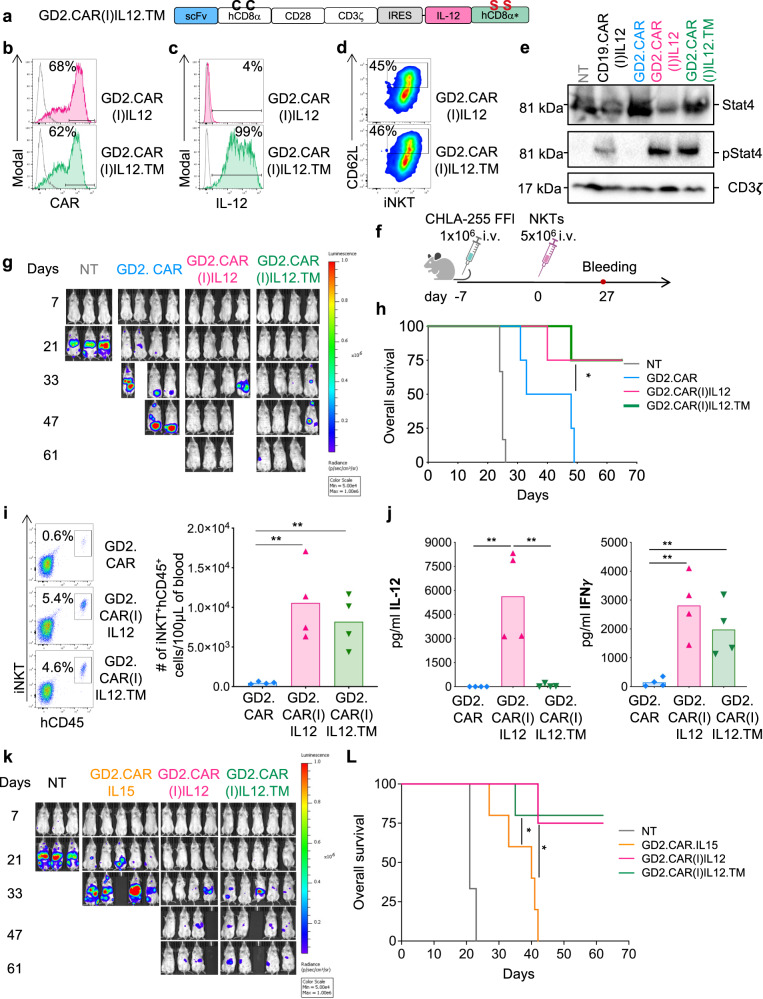
Fig. 7. Membrane-bound IL-12 and soluble IL-12 have comparable effects in NKTs and show superior antitumor effects compared to IL-15-expressing NKTs.
a Schematic of the retroviral vector encoding the GD2.CAR and membrane-bound IL-12 in which the mutated CD8α stalk was added to IL-12 (IL12M). b Representative flow cytometry plots of 5 donors showing CAR expression in GD2.CAR(I)IL12 and GD2.CAR(I)IL12.TM NKTs assessed at day 14 of culture. Gray line represents non-transduced NKTs. c Representative flow cytometry plots of 5 donors showing the expression of IL-12 on the cell surface of GD2.CAR(I)IL12 and GD2.CAR(I)IL12.TM NKTs assessed at day 14 of culture. Gray line represents non-transduced NKTs. d Representative flow cytometry plots of 5 donors showing CD62L expression in GD2.CAR(I)IL12 and GD2.CAR(I)IL12.TM NKTs assessed at day 14 of culture. e Representative western blot illustrating STAT4 phosphorylation in NT, CD19.CAR(I)IL12, GD2.CAR, GD2.CAR(I)IL12 and GD2.CAR(I)IL12.TM NKTs at day 14 of culture; n = 3. Source data are provided as a Source Data file. f Schematic representation of the metastatic xenograft neuroblastoma model. Mice were engrafted i.v. with 1 × 10⁶ CHLA-255 Firefly-luciferase labeled neuroblastoma tumor cells and treated with 5 × 10⁶ NT, GD2.CAR, GD2.CAR(I)IL12 and GD2.CAR(I)IL12.TM NKTs. g Representative tumor BLI; n = 4 from two independent experiments. h Kaplan–Meier survival curve showing overall survival; n = 4 mice, *p = 0.0344 GD2.CAR vs GD2.CAR(I)IL12.TM NKTs; log-rank Mantel–Cox test. Source data are provided as a Source Data file. i Representative flow cytometry plots (left panels) and quantification of human NKTs (iNKT+CD45+) in peripheral blood samples (right panel) collected 4 weeks after NKT infusion. Mean is shown; n = 4 mice; **p = 0.0060 GD2.CAR vs GD2.CAR(I)IL12 NKTs, **p = 0.0035 GD2.CAR vs GD2.CAR(I)IL12.TM NKTs, two-tailed unpaired t test. Source data are provided as a Source Data file. j Quantification of IL-12 and IFN-γ detected in the serum of mice at sacrifice. Mean is shown; n = 4 mice; IL-12: **p = 0.0077 GD2.CAR vs GD2.CAR(I)IL12, **p = 0.0081 GD2.CAR(I)IL12 vs GD2.CAR(I)IL12.TM; IFNγ: **p = 0.0032 GD2.CAR vs GD2.CAR(I)IL12, **p = 0.0086 GD2.CAR vs GD2.CAR(I)IL12.TM; two-tailed paired t test. Source data are provided as a Source Data file. k, L Metastatic xenograft neuroblastoma model in which mice were treated with GD2.CAR.IL15 or GD2.CAR(I)IL12 or GD2.CAR(I)IL12.TM NKTs following the tumor model described in (f). k Representative tumor BLI. L Kaplan–Meier survival curve showing overall survival; n = 3 mice for NT, n = 4 mice for GD2.CAR(I)IL12 and n = 5 mice for GD2.CAR.IL15 and GD2.CAR(I)IL12.TM NKTs, *p = 0.0112 GD2.CAR.IL15 vs GD2.CAR(I)IL12; *p = 0.0197 GD2.CAR.IL15 vs GD2.CAR(I)IL12.TM NKTs; log-rank Mantel–Cox test. Source data are provided as a Source Data file.

