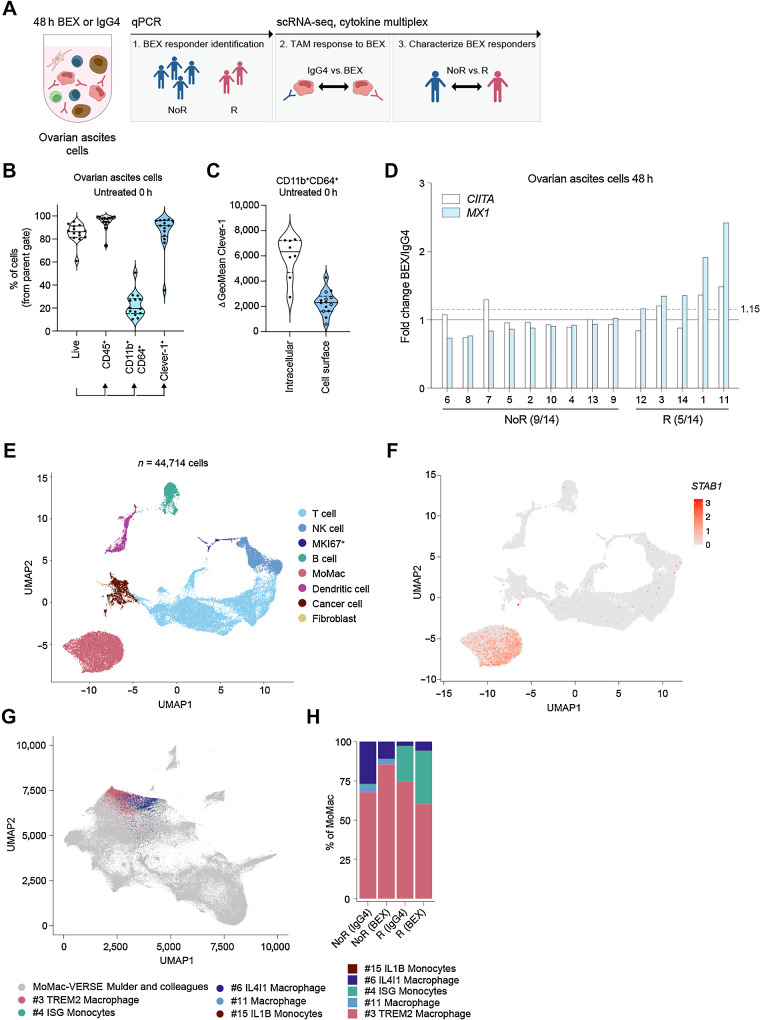
Figure 1.
Profiling of bexmarilimab responses in ovarian ascites TAMs with scRNA-seq. A, Characterization of bexmarilimab responses and responding patients in ovarian ascites cells. B, Flow cytometry staining of untreated ovarian ascites cells (n = 14 patients). Violin plots show proportions of live cells, CD45+ immune cells, CD11b+CD64+ MoMacs and Clever-1+ cells (median and quartiles). Percentages were calculated from the parent gate and Clever-1 expression measured from the cell surface. C, Total (n = 8) and cell surface (n = 14) Clever-1 expression on CD11b+CD64+ ovarian ascites cells. Open circles represent patients with cell surface staining only. D, Change in MX1 and CIITA gene expression measured by qPCR from ovarian ascites cells treated with bexmarilimab or IgG4 for 48 hours. The dashed line indicates MX1 cutoff for responder identification and fractions indicate proportions of R and NoR patients. E, scRNA-seq of ovarian cancer ascites cells (n = 7 patients) treated ex vivo with bexmarilimab or IgG4 for 48 hours. UMAP dimensionality reduction of cells colored by main cell type clusters. F, UMAP colored by Clever-1 expression (STAB1). G, Mapping of monocytes and macrophages (n = 10,358 cells) to MoMac-VERSE atlas created by Mulder and colleagues. Original MoMac-VERSE UMAP plot is colored in gray and mapped cells colored by MoMac-VERSE clusters. H, Bar graph showing percentage of ovarian ascites monocytes and macrophages mapped to each MoMac-VERSE cluster (R, n = 4; NoR, n = 3 patients). BEX, bexmarilimab; IgG4, isotype control for bexmarilimab.

